Newsletters
- Home
- Publications
- Newsletter Archive
- Newsletter
November/December 2020
Inside This Issue:
- Research Examines Student Participation in Public School Sports
- We're Getting a New Look
- Chairman's Message
- Pennsylvania and COVID-19: Cases, Drug Overdoses, and Unemployment
- Rural Snapshot: Fall School Sports Participation
- Decline in Fire Calls Across Pennsylvania
- Just the Facts: SNAP Enrollment During COVID-19
Research Examines Student Participation in Public School Sports
In 2019, the Center sponsored two research projects to get baseline data on Pennsylvania public school sports participation. The results are now in and here’s what the research found.
Analysis of Expenditures and Participation in Public School Sports
Dr. Brian Foster and Dr. James Mattern of Lock Haven University of Pennsylvania examined the relationship between interscholastic athletic participation, school athletic expenditures, socioeconomic indicators, and Pennsylvania school district-level indicators using 2014-2017 data from the Pennsylvania Department of Education. The research found that:
- Athletic participation is statistically related to several positive outcomes, including decreased school suspensions in rural areas, increased Keystone Exam scores in urban areas, and increased graduation rates in urban areas.
- Trends in participation rates were:
- Rural boys - Football, outdoor track and field, and basketball were the three most popular sports. Noteworthy participation changes from 2014-15 to 2016-17 included lacrosse, and tennis.
- Rural girls - Outdoor track and field, softball, and volleyball were the most popular sports. Noteworthy participation changes included swimming and diving, and soccer.
- Urban boys - Football, outdoor track and field, and baseball were the most popular sports. Noteworthy participation changes from 2014-15 to 2016-17 were indoor track, and swimming and diving.
- Urban girls - Outdoor track and field, soccer, and basketball were the most popular sports. There were generous increases in participation across most sports except gymnastics.
- Urban districts spent significantly less than rural districts per student-athlete for travel, supplies and equipment, facilities, athletic training, and other expenditures. This occurred while rural districts received 15 percent less in contributions and purchases per student-athlete.
- Total athletics expenses increased more rapidly in rural districts than in urban districts.
Exploring Disparities in School Sports Participation in Rural Pennsylvania
Dr. M. Blair Evans of The Pennsylvania State University examined trends in rural and urban Pennsylvania public school sports participation, alongside sociodemographic aspects of schools and communities that contribute to these trends. The research found:
- In some cases, urban students experience increased sports opportunities compared to rural students €“ but these differences can be subtle and contingent on school size.
- For sports involvement in rural schools only, socioeconomic factors were perhaps the most consistent predictors of school sports involvement. These included the level of disadvantage within the district, such as employment, education, and income, and the percentage of students receiving free-or-reduced school lunches.
- Similarly, rural schools in districts facing socioeconomic disadvantage were also the least likely to integrate policies and practices that may strengthen sports programs, such as late bussing.
- Resources seemed critical for many practices that support sports involvement, such as late bussing. Oftentimes, however, the more powerful predictors of rural sports involvement were socioeconomic factors that were more general in nature.
The research suggests that requiring the total number of students involved in sports, regardless of the number of teams in which they participate, to be reported would help when comparing urban and rural school sports teams, as the qualitative data suggest that rural schools may be supportive of multi-sports athletes.
The research also noted that reporting of school policies, such as pay-to-play policies, late bussing, and intramural program participation, could help with evaluations of the effectiveness of these practices in encouraging sports participation.
Click here for the report Analysis of Expenditures and Participation in Public School Sports, and here for the report, Exploring Disparities in School Sports Participation in Rural Pennsylvania.
We're Getting a New Look
In the coming months, the Center for Rural Pennsylvania is going to change its look by introducing a new logo, and an updated newsletter and website. We're excited to share our updated look, but rest assured, our commitment to rural policy research and data analyses will remain strong. Stay tuned.
Chairman's Message
I’ve heard it many times: this has been a year like no other. What an appropriate way to describe 2020. With the pandemic still affecting Pennsylvania, the nation, and the world, we are all trying to manage our everyday lives and cope with the challenges and threats of COVID-19. It doesn’t matter if you live in a rural area, an urban area, or anywhere in between. This virus knows no boundaries.
Many of the articles in this issue focus on the pandemic and its impact in Pennsylvania. The two most devastating have been the lives we’ve lost and the number of people who have fallen ill to the virus.
Another disturbing impact is the increase in overdose deaths in our rural counties. Information compiled by the National Institute of Environmental Health Sciences indicates that stress and social isolation may make it much more difficult for people to maintain their mental health, especially people who are in recovery. If you know of someone who is struggling with their recovery and needs to find treatment, please call 1-800-662-HELP. You can also visit the Pennsylvania Department of Drug and Alcohol Program’s website at https://apps.ddap.pa.gov/gethelpnow/.
As I write this message, the number of COVID cases are continuing to rise. During this time of thanksgiving, we can’t thank our health care workers enough for everything they have done over these many months. These front-line workers continue to put their own health and lives on the line to help us fight against this pandemic. We also owe huge thanks to other front-line workers €“ our grocery store workers, restaurants, manufacturers, and police and fire personnel, for example €“ who also have worked tirelessly throughout the pandemic, and who continue to do so.
As this peculiar year comes to an end, I’d like to thank all of our board members for the work they do on behalf of the Center and rural Pennsylvania.
Rep. Garth Everett will be leaving the board this year as he retires from the legislature. We truly appreciate his service to the board, and the knowledge and guidance he has provided over the years to expand the work of the Center. On behalf of the board and staff, I wish him all the best in his retirement, and in the years ahead.
I also wish all of you healthy and happy holidays.
Senator Gene Yaw
Pennsylvania and COVID-19: Cases, Drug Overdoses, and Unemployment
Reported COVID Cases
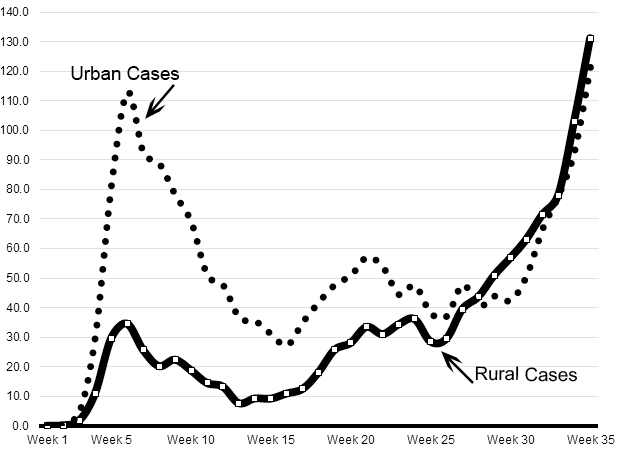
As of October 31, 2020, 38,676 rural Pennsylvanians were reported to have COVID-19. That’s about 1,145.2 cases per 100,000 residents. In urban Pennsylvania, there were 171,823 reported cases of COVID-19, or 1,823.1 cases per 100,000 residents.
As of October 31, 1,041 rural Pennsylvanians died due to COVID-19, or 30.8 deaths per 100,000 residents. In urban Pennsylvania, there were 7,895 deaths, or 83.8 per 100,000 residents.
Weekly Number of COVID-19 Cases per 100,000 Rural and Urban Pennsylvania Residents, March 1, 2020 to October 31, 2020
(Week is Sunday through Saturday)
Drug Overdoses
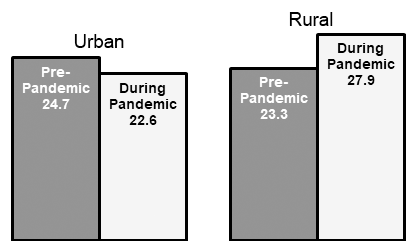
In Pennsylvania there was a 1 percent decline in reported overdose incidents from the pre-pandemic period of March 18 to October 15, 2019 to the pandemic period of March 18 to October 15, 2020. During the pre-pandemic period, there were 3,120 overdose incidents, or an average of 14.7 per day. During the pandemic period, there are 3,077 reported overdoses incidents, or an average of 14.5 per day.
However, much of the decline in overdose incidents occurred in urban counties. From the pre-pandemic period to the pandemic period, the number of overdoses in urban counties declined 8 percent. During that same period, the number of incidents in rural counties increased 20 percent. Per capita, rural counties now have more overdose incidents than urban counties (27.9 and 22.6 per 100,000 residents, respectively.)
Overdose Rates in Rural and Urban PA Counties, Pre-Pandemic Period and Pandemic Period
(Rate is per 100,000 Residents)
Unemployment Rates
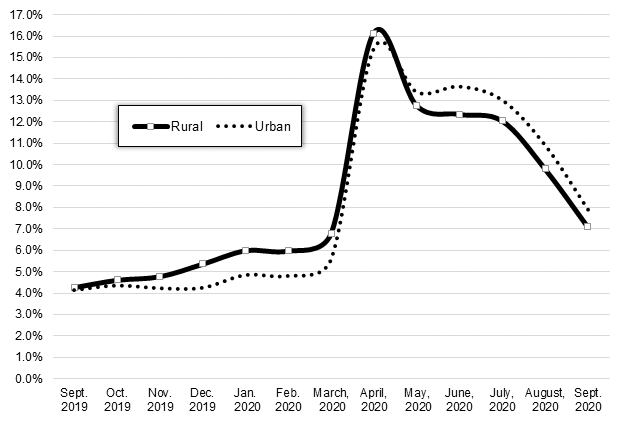
From September 2019 to September 2020, the number of employed rural Pennsylvanians declined by 98,600, or 6 percent. In urban Pennsylvania during the same period, employment declined by 271,100, or 6 percent.
From March 2020 to September 2020, the unemployment rate, on average, was lower in rural areas than in urban areas (11.0 percent and 11.4 percent, respectively). The September 2020 rural unemployment rate was 7.1 percent and the urban rate was 7.9 percent.
Unemployment Rates in Rural and Urban Pennsylvania, September 2019 to September 2020
(Rates are not seasonally adjusted)
Rural Snapshot: Fall School Sports Participation
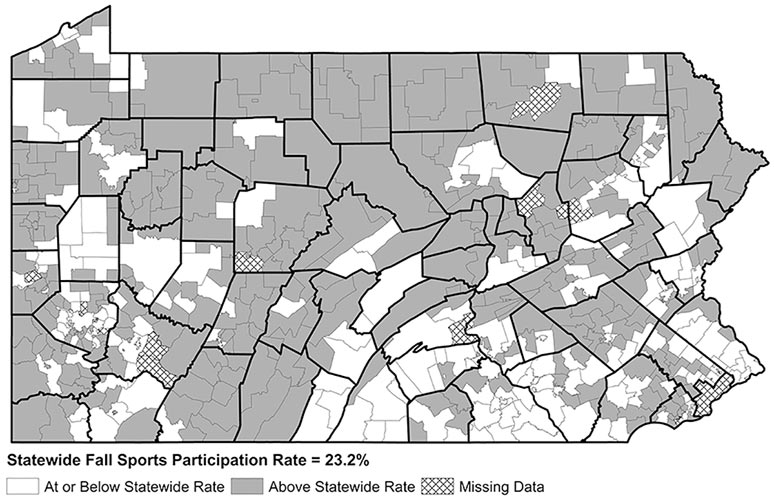
Note: Except for expenditure data, all data are for Pennsylvania public school fall sports for Grades 7 - 12. Fall sports were defined using the Pennsylvania Interscholastic Athletic Association list of fall sports. The data may include students who participate in two or more sports during the same season. Seventeen school districts had either no data or incomplete data. These districts were excluded from the analysis. Data sources: Pennsylvania Department of Education, National Federation of State High School Associations, and the 2018, 5-year Average, American Community Survey, U.S. Census Bureau
Fall Sports Participation Rate by School District, 2018-2019
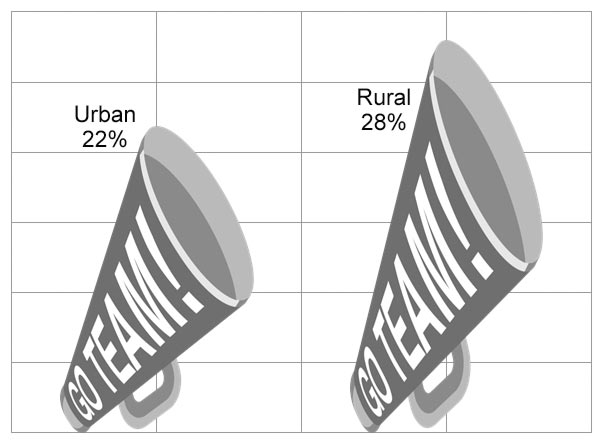
Rural and Urban Student Participation Rates in Fall Sports, 2018-2019
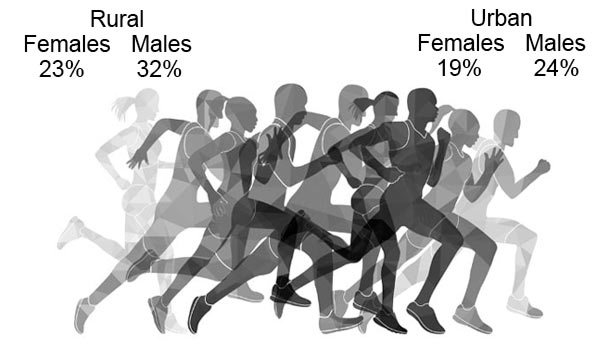
Rural and Urban Student Participation Rates in Fall Sports, by Gender, 2018-2019
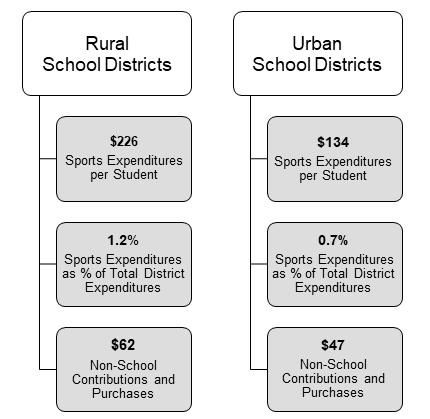
Pennsylvania Annual School Sports Expenditures, 2018 €“ 2019
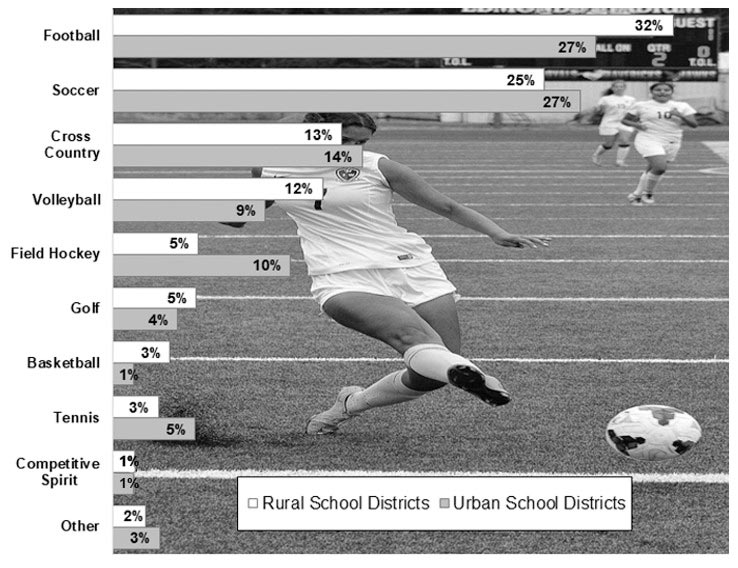
Percent of Rural and Urban Students Participating in Fall Sports by Type, 2018-2019
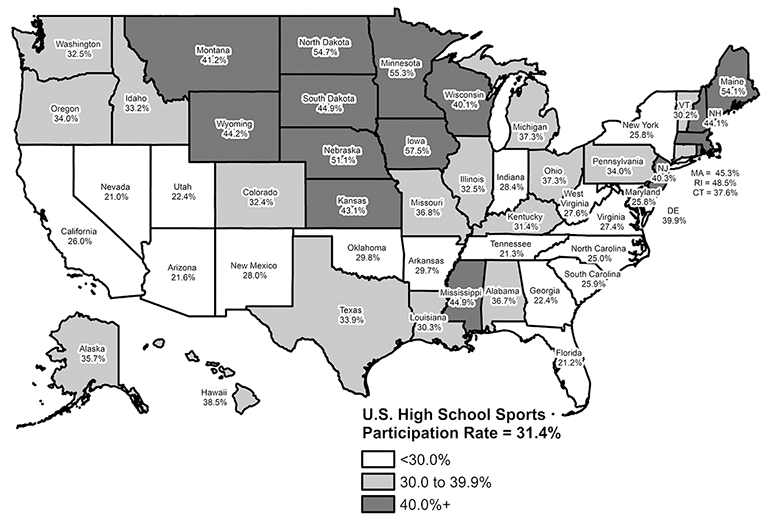
School Sports Annual Participation Rates by State, 2018-2019
Decline in Fire Calls Across Pennsylvania
Here’s a bit of good news: the number of fire calls has declined in Pennsylvania.
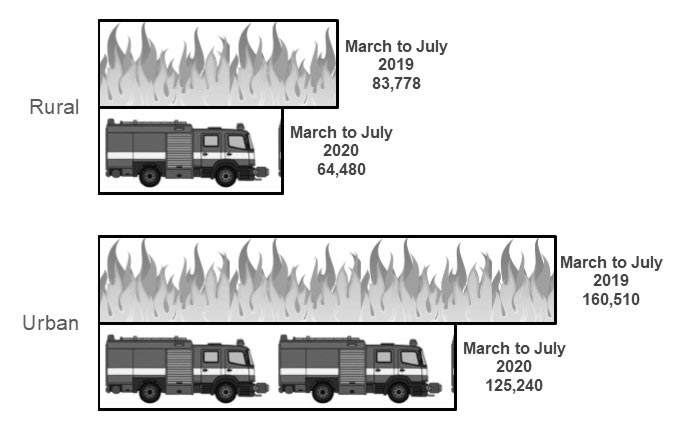
Using data from the Pennsylvania Fire Commissioner’s Office, the Center for Rural Pennsylvania compared the number of fire calls over the 5-month period of March to July 2019 to the same 5-month period in 2020. The Center analyzed only companies that reported calls for both time periods.
The results showed that rural fire companies responded to 23 percent less fire calls in 2020 than they did in 2019. Urban fire companies responded to 22 percent less calls during this same period (note that the data exclude Philadelphia County and the City of Pittsburgh).
For rural fire companies, this decline meant one fewer fire call per week, on average. For urban companies, that meant two fewer calls per week, on average.
The counties with the largest declines were Cameron, Butler, and Armstrong, each with a decline of more than 40 percent. Adams County was the only county with an increase (2 percent).
Data are not yet available on the types of fire calls over this period, so it’s difficult to determine why there has been a decline. However, it is probably safe to guess that the change was not entirely caused by fewer drivers on the road. Data from 2015-2017 show that only 8 percent of rural fire calls and 6 percent of urban fire calls were for vehicle fires.
Fire Calls in Rural and Urban Pennsylvania, March to July 2019 and 2020
Just the Facts: SNAP Enrollment During COVID-19
The COVID-19 pandemic is creating a slew of economic difficulties for rural and urban Pennsylvania families, one of which is hunger.
Data from the Pennsylvania Department of Human Services indicate that there was an increase in the number of rural and urban Pennsylvanians participating the in Supplemental Nutrition Assistance Program (SNAP).
To qualify for SNAP assistance in Pennsylvania, a three-person household must have a monthly income of less than $2,311.
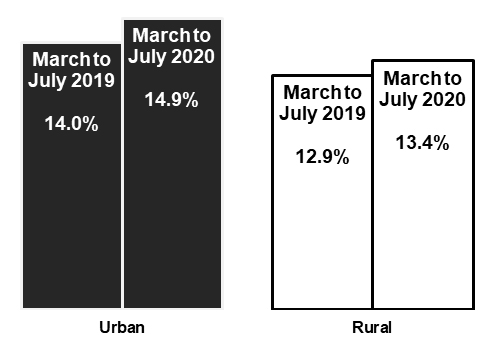
From March to July 2020, 452,884 rural Pennsylvanians, on average, participated in SNAP, which was a 4 percent increase from the same five-month period in 2019. In urban Pennsylvania, 1.40 million residents, on average, participated in SNAP from March to July 2020, an increase of 6 percent from the same period in 2019.
At the national level, the most current SNAP enrollment data from the U.S. Department of Agriculture are from April 2020. Data from March and April 2020 show that more than 40 million individuals, on average, were enrolled in SNAP. This was a 7 percent increase from March through April 2019, on average.
The percent of rural Pennsylvanians enrolled in SNAP from March to July 2020 was positively correlated with the average unemployment rate during this period. This means that as the unemployment rate increased, so did SNAP enrollments. There was, however, no significant correlation between SNAP enrollment and the number of COVID-19 cases per capita. This same pattern also occurred in urban Pennsylvania.
One of the challenges SNAP participants face in both Pennsylvania and the U.S. is finding retailers that accept SNAP payments. In 2020, there were 9,802 SNAP retailers in Pennsylvania, a decrease of 2 percent from 2019. Nationwide, there was a 2 percent decrease in the number of SNAP retailers as well.
Percent of Rural and Urban Pennsylvania Residents Receiving SNAP, March to July 2019 and 2020
