Newsletters
- Home
- Publications
- Newsletter Archive
- Newsletter
July/August 2021
Inside This Issue:
- Research Documents Increase in Suicide Rates in Pennsylvania
- Chairman's Message
- Center to Host New Policy Series, Kick-Off Session is July 22
- Rural Snapshot: Projected Change in Pennsylvania Employment, 2018 to 2028
- Births and Maternal Access to Care
- Just the Facts: Billboard Advertising
Research Documents Increase in Suicide Rates in Pennsylvania
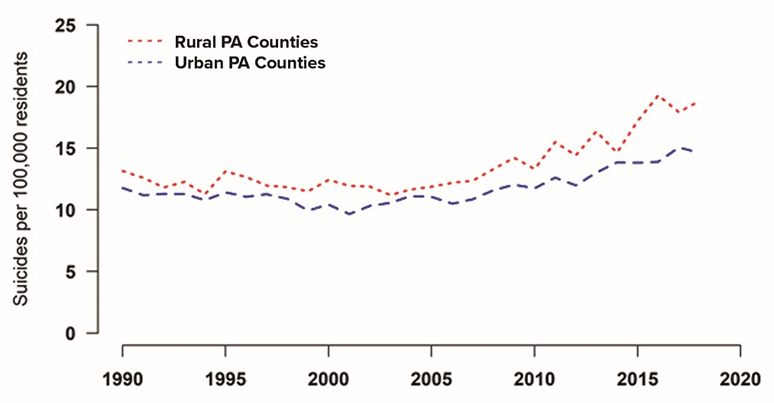
Suicide rates in Pennsylvania have increased considerably from 1999 to 2018, with the suicide rate among rural counties being higher, on average, than the rate in urban counties, according to recently released research sponsored by the Center for Rural Pennsylvania.
The research found that, on average, the gap between rural and urban county suicide rates has been increasing, especially over the last decade. In 2018, the rate in rural counties was 25 percent higher than the rate in urban counties. However, the overall rates mask substantial variation among rural and urban counties, according to report authors Dr. Daniel Mallinson, Eunsil Yoo, and Brandon Cruz of Penn State Harrisburg.
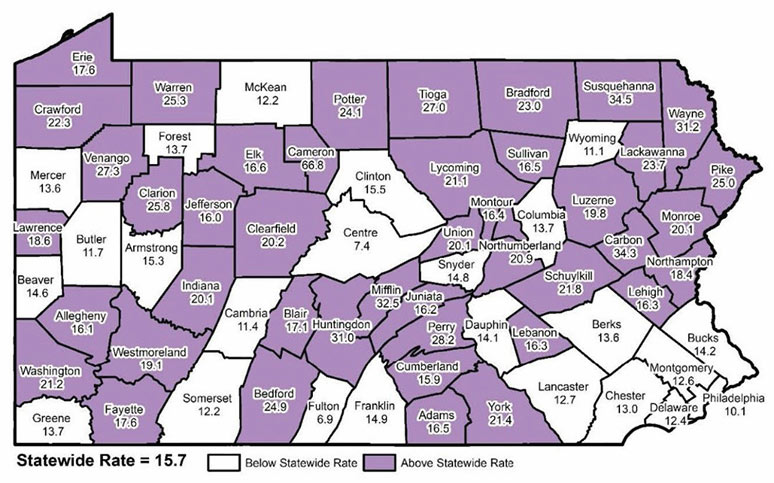
For example, while rural counties had the largest increases in suicide rates from 1999 to 2018, York County, which is defined as an urban county by the Center, had a substantially higher rate in 2018, and a greater increase from 1999 than other urban counties. York County has large rural areas, so it is important to consider how rural and urban trends vary even within counties.
Study Background
The research, conducted in 2020, examined the overall trends in suicide across Pennsylvania’s 67 counties from 1990 to 2018, the suicide prevention programs currently used by counties, and the programs that are used in K-12 school districts.
The research used data from the Pennsylvania Department of Health and the U.S. Census Bureau to examine the trends in suicide rates, as well as which factors, such as access to firearms, correlate with county rates. Data on county and school district programs were gathered using two surveys fielded in June and November 2020. A total of 46 counties (69 percent) and 134 school districts (31 percent) responded to the surveys. Data were gathered on each program’s description, clients served, engagement with external partners, resources, evaluation procedures, and the impact of COVID-19 on the program’s operation.
In assessing the factors that correlate with higher or lower suicide rates in Pennsylvania, the researchers found that higher numbers of handgun sales per 1,000 residents, lower levels of education, lower incomes, larger populations over age 65, and higher levels of unemployment were all correlated with higher county suicide rates from 1999 to 2018. Even when controlling for all other factors, the rural county suicide rate was higher than the urban rate. Many of the above factors themselves have rural-urban divides, thus compounding the risks for rural residents. It also appeared that broadband internet access limitations correlated with county suicide rates in 2015 and 2016, but broadband could be serving as a substitute for rural in this case.
County, School Prevention Programs
Rural and urban counties reported a diverse array of suicide prevention programming. In general, rural counties were more likely to form cross-county partnerships to pool resources and expand their reach. Rural counties were also more reliant on non-county funds and networks of external partners for providing their programs. Urban counties tended to be more self-sufficient. Rural counties were also more likely to provide programs for broad audiences, whereas urban counties reported more programs that focused on a specific audience.
Rural county programs were harder hit by the COVID-19 pandemic, with many having to shutter. Urban programs exhibited greater resilience in shifting to online platforms.
School districts varied in their suicide prevention programming, but the differences between rural and urban districts in resourcing and programming were fewer than those among rural and urban counties. Awareness and education were the most common programs provided by both rural and urban school districts. Roughly half reported their programs as being part of their Student Assistance Program (SAP). Many programs, like student clubs, were reported to have no cost to the school district.
The research report, Suicide Trends and Prevention in Rural Pennsylvania Counties and Schools, is available on the Center’s website.
Suicide Rates in Urban and Rural PA Counties, 1990-2018
Suicide Rates per 100,000 Residents, by County, 2018
Chairman's Message
Someone dies by suicide every 11 minutes in the U.S., according to the Centers for Disease Control and Prevention.
The CDC also says that suicide rates vary by race/ethnicity, age, and other factors, with the highest rates among American Indians/Alaska Natives and non-Hispanic whites. Other Americans with higher than average rates of suicide are veterans, people who live in rural areas, and workers in certain industries and occupations like mining and construction.
In 2020, the Center sponsored research on suicide trends and prevention to learn more about suicide in our rural and urban counties. That research, featured on Page 1, found that suicide rates in Pennsylvania have increased substantially from 1999 to 2018, and that in 2018, the suicide rate in our rural counties was 25 percent higher than the rate in our urban counties.
While the research did not focus on occupations or industries, other research has shown that farmers are at higher risk for suicide than the general population. In Pennsylvania, the Department of Agriculture, Pennsylvania Farm Link, and other farmer and farming organizations have been reaching out to farmers and their families about the stressors that often accompany farming, and how these stressors may affect mental health, and sadly, put them at higher risk for suicide.
In February 2020, my colleague Sen. Elder Vogel and state Agriculture Secretary Russell Redding led a roundtable discussion at Penn State Beaver to talk about the factors that put Pennsylvania farmers at high risk for mental health disorders and suicide. As a continuation of that discussion, the Senate Agriculture and Rural Affairs Committee held a public hearing in September 2020 to learn how the COVID-19 pandemic may have further affected Pennsylvania’s farming community.
At that hearing, the testifiers said that farmers are traditionally less likely to seek out professional help for mental health concerns than the average adult. Testifiers also emphasized that rural areas have fewer mental health professionals, which we know to be true from prior research, and that the costs of treatment can also deter people from seeking help. To elevate awareness about the importance of mental wellness among the farming community, the Pennsylvania Department of Agriculture and Farm Link have resources available on their websites.
And for anyone who is feeling overwhelmed, stressed, anxious or alone, the Pennsylvania Department of Human Services offers free crisis counseling through the Support and Referral Helpline at 1-855-284-2494. For TTY, dial 724-631-5600. Trained professionals are available 24/7.
If you or someone you know is experiencing a mental health crisis or is considering suicide, help is also available by contacting the National Suicide Prevention Lifeline at 1-800-273-TALK (8255).
Senator Gene YawCenter to Host New Policy Series, Kick-Off Session is July 22

Join the Center on July 22 as it kicks off its new virtual 2021 Rural Policy Summit series. “Our plan for the Rural Policy Summit is to bring together a wide range of stakeholders €“ including policymakers, nonprofit leaders, academic researchers, and industry professionals €“ to learn about and discuss major policy issues that will affect rural Pennsylvania over the next 5 to 10 years,” Center Director Dr. Kyle C. Kopko said.
“As we all know, there are many challenges and opportunities facing rural Pennsylvania. This summit will explore policy issues in an interdisciplinary way so that community leaders are better equipped to meet the needs of Pennsylvania’s nearly 3.4 million rural residents.”
The five topic areas are education, health care, local services, economic development, and agriculture.
The July 22 session will kick-off the series by providing a broad demographic overview of rural Pennsylvania, which will help set the stage for the following sessions to be held each month beginning in September and wrapping up in January 2022. The sessions will be held via Zoom.
The series is being cohosted by the Pennsylvania Office of Rural Health, Pennsylvania Rural Development Council, Pennsylvania Department of Community and Economic Development, Pennsylvania Downtown Center, and Philadelphia Federal Reserve Bank’s Community Development and Regional Outreach Department.
Sign up information for the July session at this zoom link.
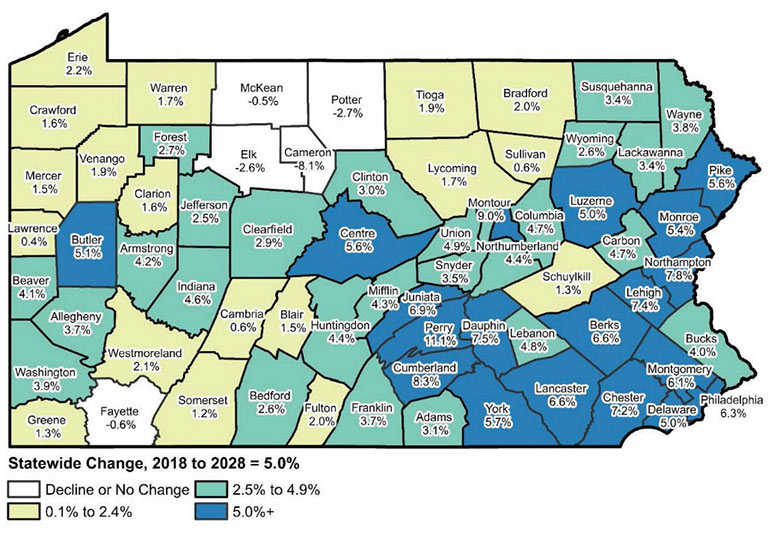
Rural Snapshot: Projected Change in Pennsylvania Employment, 2018 to 2028
About the Data:
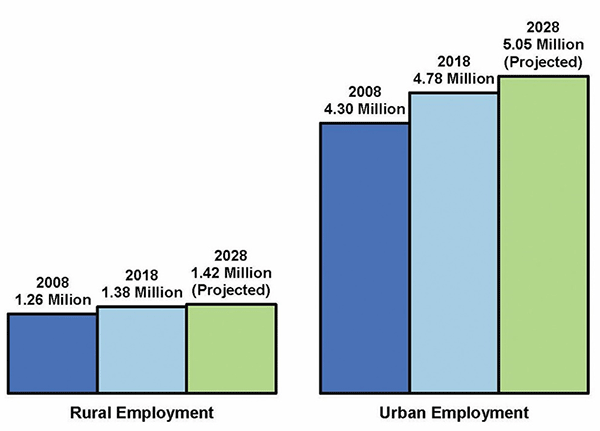
The population projections were derived by the Pennsylvania Department of Labor and Industry and are based on a monthly survey of employers (Current Employment Statistics Program) and a quarterly tax report from employers (QCEW program). Long-term industry projections were produced by the U.S. Bureau of Labor Statistics through regression analysis using historical employment data, and by considering economic and demographic factors. Specifically, key considerations were given to the area's projected population of people age 16 and above (current and projected by the U.S. Census Bureau), labor force participation rate, unemployment rate, industry employment trends, and share of national employment. The projections are estimates of employment levels and trends, not exact counts. The data reflect the number of jobs in an industry, not the number of people, since no attempt is made to correct for multiple job-holdings. Jobs include those that are both full-time and part-time. The 2008 data do not include all the employment categories that are included in the 2018 and 2028 data. Data source: Pennsylvania Department of Labor and Industry.
Percent Change in Employment, 2018 to 2028 (projected)
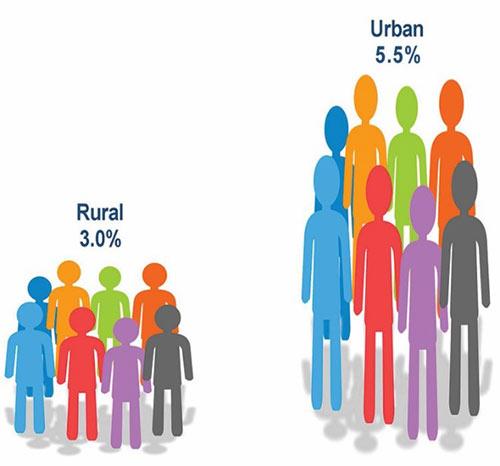
Percent Change in Rural and Urban Projected Employment, 2018 to 2028
Rural and Urban Pennsylvania Employment, 2008 to 2028 (Projected)
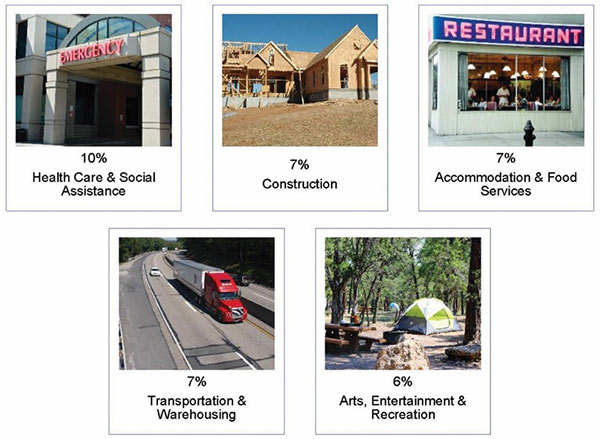
Projected Five Fastest Growing Industries in Rural Pennsylvania
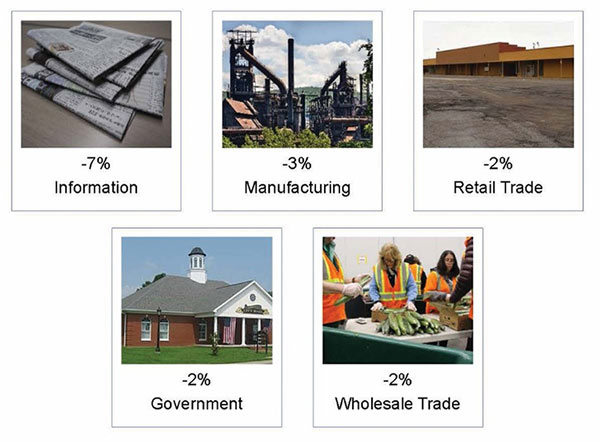
Projected Five Slowest Growing Industries in Rural Pennsylvania
Births and Maternal Access to Care
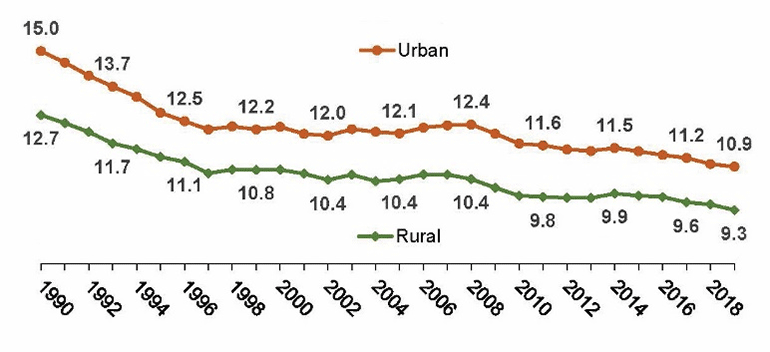
Pennsylvania welcomed 134,247 babies in 2019, according to the Pennsylvania Department of Health. Live births per 1,000 residents in Pennsylvania have decreased from 1990 to 2019. In rural Pennsylvania, the rate went from 12.7 to 9.3 live births per 1,000 residents, and in urban Pennsylvania from 15.0 to 10.9.
Live Births Per 1,000 Residents, 1990 to 2019
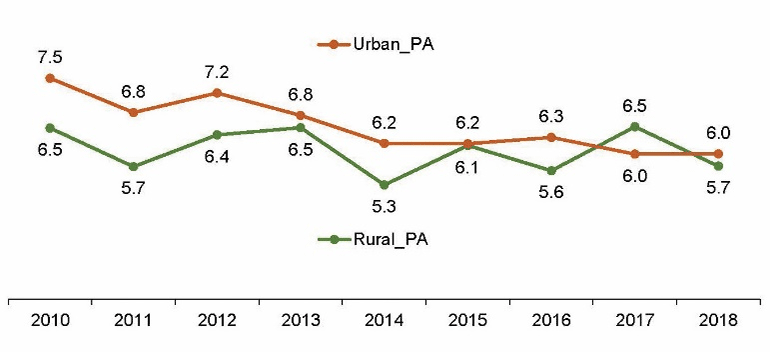
Infant mortality rates have been declining in Pennsylvania since 2010. In 2019, the rates were 6.0 mortalities per 1,000 live births in urban counties and 5.7 mortalities per 1,000 live births in rural counties.
Infant Mortality Rates Per 1,000 Live Births, 2010-2018
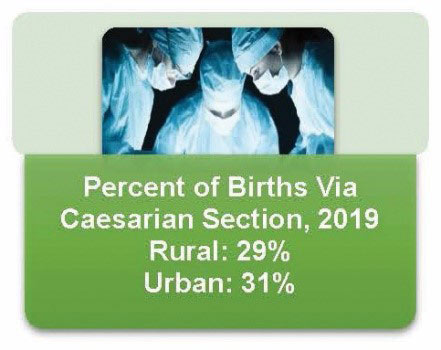
In 2019, more urban county mothers (31 percent) gave birth through caesarian section than rural county mothers (29 percent).
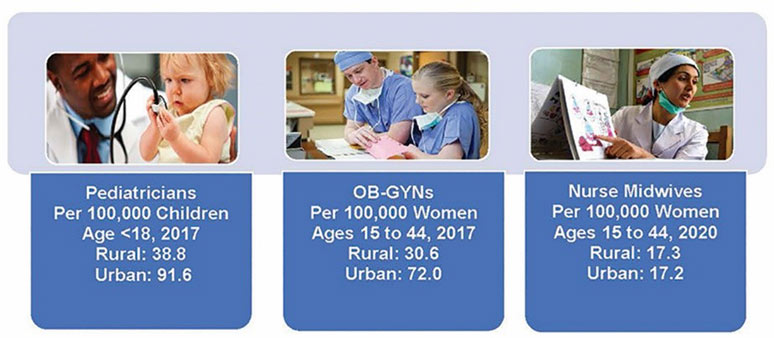
There are fewer pediatricians and obstetrics/gynecologists in rural counties. There are 38.8 pediatricians per 100,000 children and 30.6 OB-GYNs per 100,000 women in rural counties, and 91.6 pediatricians and 72.0 OB-GYNs per 100,000 women in urban counties in 2017. The rates for nurse midwives per 100,000 women are similar in rural and urban counties.
Neonatal Intensive Care Units (NICU) are intensive care units specializing in the care of ill or premature newborns. About 42 percent of rural residents live within 15 miles of a hospital with a NICU, while 95 percent of urban residents live within 15 miles of these units.
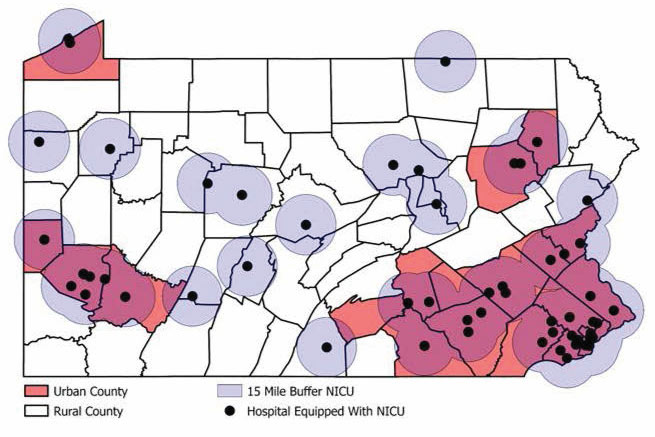
Data sources: Pennsylvania Department of Health, Pennsylvania Department of State, U.S. Health Resources and Services Administration, and U.S. Census Bureau.
Just the Facts: Billboard Advertising
When it comes to outdoor advertising, billboards are big in Pennsylvania.
According to data from the Pennsylvania Department of Transportation (PennDOT), in 2020, there were about 8,800 billboards along state and federal roadways in rural Pennsylvania, or one billboard for every 3.1 miles of roadway. In urban Pennsylvania, there are more than 11,400 billboards, or one billboard for every 1.3 miles of state or federal roadways.
These structures take on many shapes and sizes. In general, rural billboards are 241 square feet and 8.9 feet high, and urban billboards are 347 square feet and 15.6 feet high.
In addition, there are fewer rural billboards with changeable messages (2 percent) than urban billboards (7 percent). Rural areas also have fewer billboards with surface lighting (7 percent) than urban areas (29 percent).
In rural Pennsylvania, five companies own 50 percent of all billboards. In urban Pennsylvania, three companies own 57 percent of all billboards.
According to PennDOT’s data, 54 percent of rural billboards are in areas that do not have municipal or county zoning and 17 percent of urban billboards are in areas without zoning.
The three counties with the least number of billboards are Forest, Sullivan, and Cameron, each with fewer than 25 billboards, or an average of one billboard for every 17 miles of state and federal roadway.
The three counties with the most billboards are Philadelphia (1,111), Westmoreland (1,255), and Allegheny (2,477). All together, these three counties have, on average, one billboard every 0.6 miles.
Pennsylvania Billboard Locations*, 2020
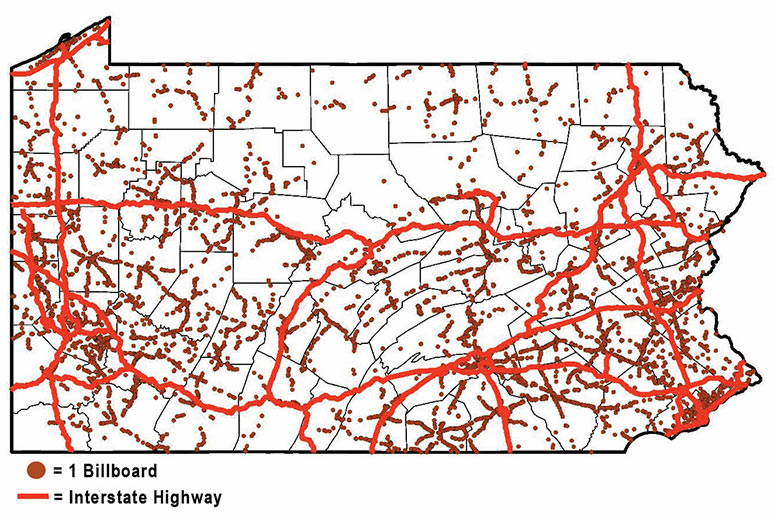
*Note: Locations are approximate. Data source: Pennsylvania Department of Transportation, Highway Beautification Management System.
