Newsletters
July/August 2020
Inside This Issue:
- The Economic Impact of Rural Community Colleges
- Thank You and Farewell
- Chairman's Message
- Research Examines K-12 Teacher Supply, Demand, Shortages
- Rural Snapshot: Young Adult Responses to 2019 Attitudinal Survey
- A Look at Overdose Incidents in Pennsylvania, January 1, 2018 to May 15, 2020
- Just the Facts: Keep on Scratching
The Economic Impact of Rural Community Colleges
Rural community colleges are often seen as a bridge for state resources and educational opportunities into geographically remote areas. Of the 14 community colleges in Pennsylvania, nine have locations in rural counties, offering that bridge to educational opportunities.
Recent research indicates that community colleges are a bridge to economic and workforce opportunities in local areas as well. In 2019, Dr. Matt Saboe, Dr. Mia Ocean, and Dr. Simon Condliffe of West Chester University of Pennsylvania conducted research to learn more about the economic impact of rural community college sites in Pennsylvania. The research was sponsored by the Center for Rural Pennsylvania.
To complete the study, the research team gathered publicly available data, and conducted telephone interviews with 16 community college employees across six community colleges and 10 locations as well as with five local industry leaders with active relationships with rural community college locations.
The study sample of rural community college sites varied in size, but represented the majority of rural Pennsylvania community college sites. Collectively, the study sample of Pennsylvania rural community colleges contributed an estimated 543 jobs, $31.9 million in value-added economic activity, such as Gross Regional Product (GRP), and $50.1 million to the total output of their local economies.
Using the economic modeling software IMPLAN and the detailed data provided by five rural community colleges, the research team found that, on average, rural sites (excluding the largest, outlier sites) support about 15 jobs, contribute $722,000 in value-added GRP, and generate about $1.25 million in total output within their local economies. This does not include the future impact of students who use the valuable skills and credentials provided by community colleges to further pursue higher education, find employment, and contribute to Pennsylvania’s economy.
The research indicated that rural community colleges are markedly invested in their communities, yet they face many challenges. Additionally, these colleges do not have access to enough resources to meet their needs. If they had access to adequate resources, they could develop additional partnerships with local industry and work to increase interest in technical fields.
The research indicated that rural community college employees have developed the needed relationships to make the most of state resources while minimizing waste. For example, many rural community colleges serve as Workforce & Economic Development Network of Pennsylvania (WEDnetPA) administrators. WEDnetPA provides funds to approved local businesses for training that is developed and facilitated by the schools. The research recommends the continued funding of the WEDnetPA program and that rural community college leaders serve as program administrators.
The research suggests that another way to capitalize on government partnerships is to expand the existing rural community college locations through the concurrent-use campus model, where community colleges and PASSHE universities share a location to maximize public spending and minimize student barriers.
In terms of funding, the researchers offer that Pennsylvania abide by Chapter 35 of Pennsylvania Code 22 and provide the required financial resources to community colleges, reevaluate base funding for these colleges, and help subsidize local sponsor fees for rural community college students who live outside of local sponsorship areas.
For a copy of the report, The Economic Impact of Rural Pennsylvania Community Colleges, click here.
Thank You and Farewell

While it should be no surprise to anyone that I am not a fan of heavy metal music, I find that a quote from well-known guitarist Dave Mustaine quite appropriately sums up my departure from the Center for Rural Pennsylvania: “Moving on, is a simple thing, what it leaves behind is hard.”
For 28 years, I have called the Center for Rural Pennsylvania my employer. Ending that was fairly simple: set a date, inform the board, and sign a bunch of forms for retirement. Easy-peasy some would say. But now comes the hard part. How do I bring to an end, or find closure for, years of doing something that has been my passion? I have worked with so many dedicated people, visited every county in Pennsylvania and numerous states for meetings and presentations where I learned more than I ever contributed, and have been a part of the public policy arena so that rural has a voice. And I have worked day in and day out with a board and staff whose talents and commitment are stellar. These all are so very hard to leave behind.
I strongly believe, though, there comes a time when moving on is the right thing to do. Step aside for fresh ideas and new ways of doing things. While my dream job is coming to an end, the friendships and the memories I have made will always remain. Thank you all!
Barry L. Denk
Chairman's Message
On behalf of the Center Board of Directors and staff, I congratulate Center Director Barry Denk on his upcoming retirement. After 28 years of service to the Center for Rural Pennsylvania and to rural Pennsylvania overall, Barry will retire at the end of July.
For more than a quarter of a century, Barry has been steadfast in his vision to carry out the mission of the Center. Under his direction, the Center has developed and maintained a reputation for being the most reliable resource for information and data on rural Pennsylvania and the citizens who call it home. In Harrisburg, across the Commonwealth, in Washington and beyond, Barry and the Center have been called upon countless times to present at conferences, formal hearings, and forums of all kinds. He is often noted for his passion and personal commitment to his work.
During Barry’s service, the Center: worked with the small network of rural Community and Higher Education Councils to obtain formal state recognition and ongoing funding; supported the establishment of Pennsylvania’s Main Street and Elm Street Programs; funded the pilot program for the statewide Area Health Education Centers; and provided strategic planning for the PA Route 6 Alliance, just to name a few. He has been a board member of the Pennsylvania Rural Health Association, Pennsylvania Downtown Center and Pennsylvania Rural Partners.
Also, through Senate and House Resolutions and gubernatorial appointments, he served on commissions addressing land use planning, poverty, broadband deployment, the Census, and education. He served as staff vice-chair and chair of the Agriculture and Rural Development Committee and staff-vice chair of the Health and Human Services Committee for the National Conference of State Legislatures, and was a charter member of the Rural Policy Research Institute’s State Rural Policy Initiative. In recent years, Barry has championed awareness and action on the opioid epidemic, the fundamental need for high-speed broadband deployment, and rural philanthropy for community and economic development.
I have worked with Barry for almost nine years and know his commitment to the mission of the Center and to rural Pennsylvania is authentic and sincere. While we will miss his leadership, he has certainly earned this next step in life’s path. I hope you all join us in wishing Barry the best in his retirement.
I am pleased to report that the Center’s board has hired Dr. Kyle C. Kopko as the new director. Kyle joins the Center July 1. He comes to us from Elizabethtown College, where he most recently served as Associate Dean of Institutional Effectiveness, Research, and Planning, and as Associate Professor of Political Science. We look forward to welcoming Kyle to the Center and working with him.
As a new era begins at the Center for Rural Pennsylvania, we are confident that the Center will continue its important work on promoting and sustaining the vitality of Pennsylvania’s rural and small communities.
Senator Gene Yaw
Research Examines K-12 Teacher Supply, Demand, Shortages
Pennsylvania has long been known as an exporter of teachers and has rarely experienced a shortage of teachers in areas other than the traditional shortage areas of math, science, English Language Learner, and special education. Recent data, however, suggest a growing shortage across the state.
In 2018 and 2019, Penn State Researchers Dr. Ed Fuller, Dr. Andrew Pendola, Dr. Kai Schafft, and Dr. Erica Frankenberg used a variety of secondary data, a focus group, and a survey of principals and superintendents to review the supply and demand of teachers to determine if there are existing, or projected, shortages of teachers in Pennsylvania.
Overall, the research found that there will be a small increase in the supply of teachers over the next 5 to 10 years. There will likely be little change in the demand for teachers as declining student enrollments that lead to a decrease in the demand for teachers are offset by increased attrition of teachers due to retirement and declining student-teacher ratios.
Currently, however, there is a shortage of teachers in Pennsylvania as evidenced by the ratio of newly prepared teachers to the number of beginning teachers hired, the dramatic increase in the number of teachers employed on long-term emergency permits, responses to research surveys, and districts’ indications of shortage areas.
The research found that the shortage is much more acute in specific subject areas and for specific areas of the state. The subject areas include special education, English Language Learner in urban areas, secondary math, and secondary science (physics, chemistry, and other advanced courses). To a lesser extent, evidence also suggests there may be shortages for secondary social studies, foreign language, physical/health education, and fine arts (music and art).
With respect to location, the research indicated shortages in some large city districts and in some rural districts. There is also evidence that many rural districts are experiencing difficulty in finding a sufficient supply of teachers in a wide array of subject areas. These shortages are projected to persist over time.
The primary cause of the shortage in Pennsylvania is the insufficient supply of individuals willing to enter the teaching profession. There are myriad underlying factors influencing this trend, but there has yet to emerge a clear research consensus about all of the factors. Some factors may include compensation, legislative changes to the pension system for teachers, and the cost of higher education in Pennsylvania.
For a copy of the research, K-12 Teacher Supply, Demand, and Shortages in Pennsylvania, click here.
Rural Snapshot: Young Adult Responses to 2019 Attitudinal Survey
About the data: The data featured here are from the Center for Rural Pennsylvania’s Attitudinal Survey of Pennsylvanians, 2019. The 2019 results are based on a panel survey of 2,008 Pennsylvanians aged 18 and older. The margin of error is +/-2.2% with a 95 percent degree of confidence. This analysis focuses on the responses from the 569 survey participants who were age 18 to 34 years old. Additional data sources are listed where applicable.
Number of Rural and Urban Young Adults and Percent of Young Adult Population in Pennsylvania, 1990 to 2018
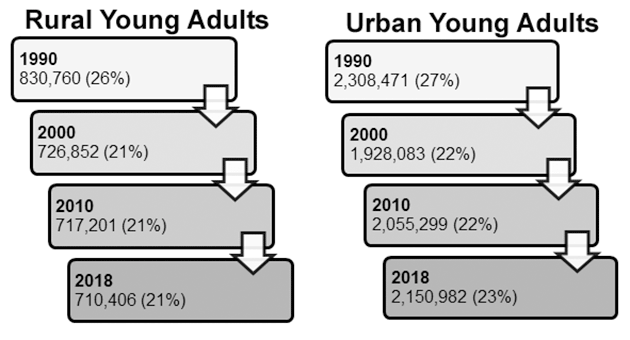
Data sources: 1990, 2000, and 2010 Censuses, and the 2018 Population Estimates, U.S. Census Bureau.
Young Adults in Rural and Urban Pennsylvania, 1990 to 2018
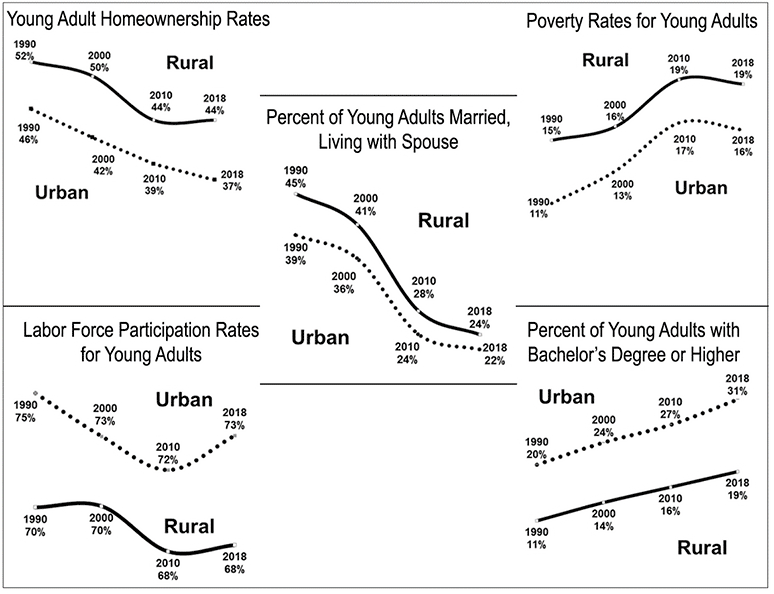
Data sources: 1990 and 2000 Censuses and the 2010 and 2018, 5-year Average, American Community Survey, U.S. Census Bureau.
46 percent of rural young adults volunteered in their community to help others either occasionally or often. These individuals tended to be unmarried, not have a college degree, and have incomes under $50,000.
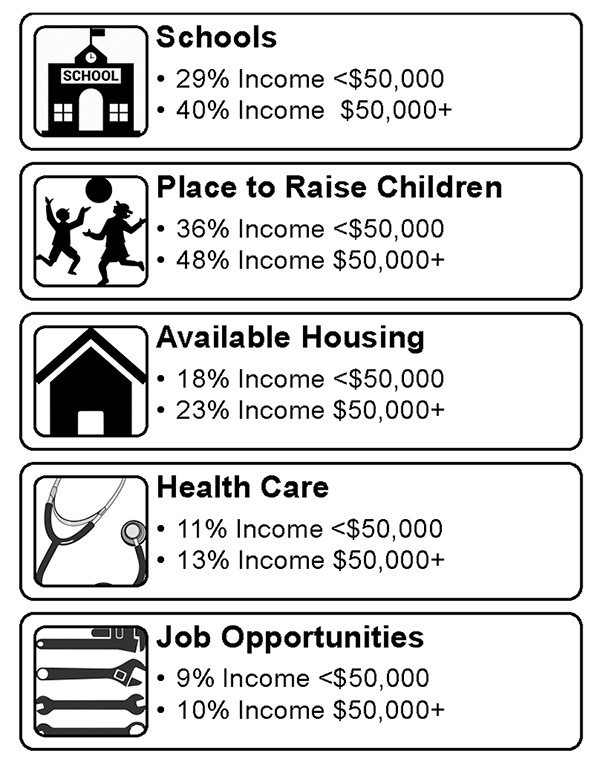
Percent of Rural Young Adults, by Income, Who Rated the Following Indicators in their Community as €œHigh€ Quality, 2019
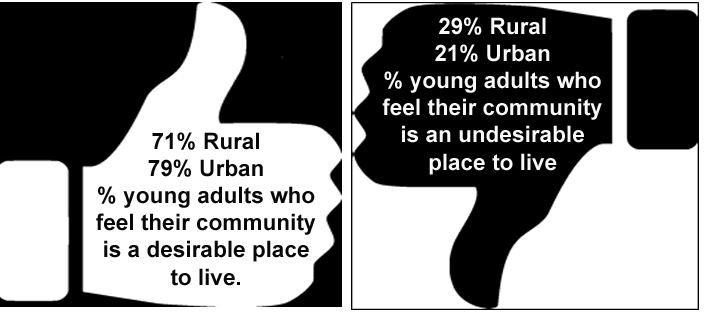
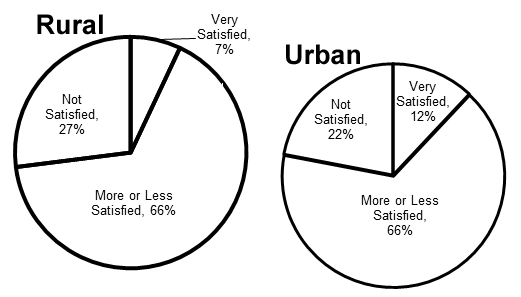
Level of Satisfaction Among Rural and Urban Young Adults in the Way Things are Going in Pennsylvania, 2019
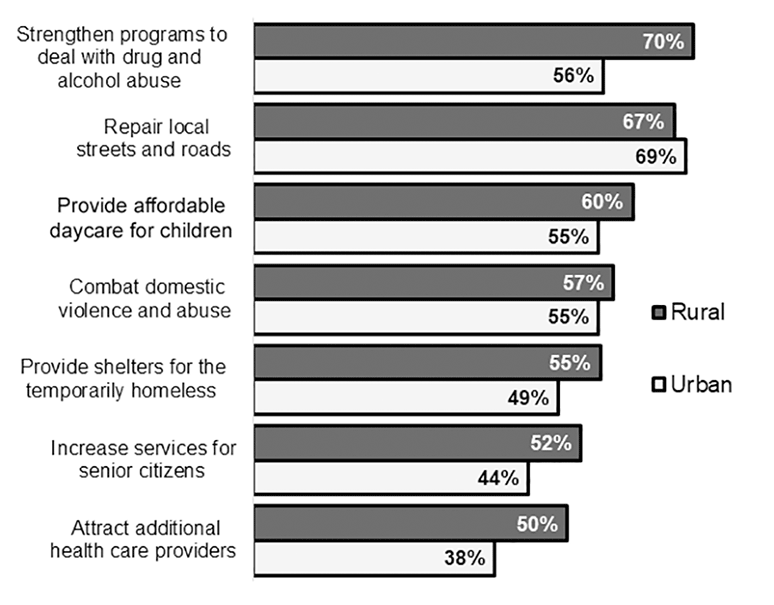
Percent of Rural and Urban Young Adults Who Said the Following Issues Should be Given a Higher Priority in their Community, 2019
(Analysis excludes €œdon't know€ answers.)
A Look at Overdose Incidents in Pennsylvania, January 1, 2018 to May 15, 2020
In March 2018, Pennsylvania launched the Overdose Information Network, a centralized repository that tracks overdoses, naloxone administrations, and other drug information, to allow police, public safety, and healthcare professionals to share all types of information related to opioid abuse in their communities. The Pennsylvania State Police maintains the information for the network, and participation in the network is voluntary.
Following is an analysis of the network data covering the period of January 1, 2018 to May 15, 2020. While all overdoses statewide may not be included in the repository, the data that are included provide a better understanding of overdose incidents in Pennsylvania.
Overdose Incidents
The network reported 12,832 overdose cases in Pennsylvania over the study period. On average, 14.8 overdoses were reported each day in Pennsylvania. Of the total number of cases, 24 percent were reported in rural areas and 76 percent were reported in urban areas. Every Pennsylvania county reported at least one overdose.
Overdoses occurred every day of the week; however, nearly 33 percent of them happened on Fridays and Saturdays. This pattern was evident in both rural and urban areas. Similarly, overdoses occurred around the clock. However, a larger volume of incidents happened in the early evening hours between 6 p.m. and 10 p.m. In both rural and urban areas, more than 25 percent of overdoses happened during this 4-hour period.
In 2018 and 2019, the summer months of June, July, and August had the highest percentages of overdoses in both rural and urban areas (29 percent and 30 percent, respectively.) The winter months of December, January, and February had the lowest percentages, with 16 percent in rural areas and 18 percent in urban areas.
Overdose Victims
In both rural and urban areas, overdose victims, on average, were white males between the ages of 25 and 39 years old.
Overall, 66 percent of rural victims were male and 34 percent were female. In urban areas, 69 percent were male and 31 percent were female. The majority of rural and urban overdose victims were between the ages of 25 and 39 years old (58 percent and 59 percent, respectively). In rural areas, 17 percent of victims were under 25 years old and 25 percent of victims were 40 years old and older. In urban areas, 13 percent of victims were under age 25 and 28 percent were age 40 and older.
Ninety-four percent of rural victims and 83 percent of urban victims were white. Non-whites and those whose race was unknown made up 6 percent of rural victims and 17 percent of urban victims.
Drug Type
According to the data, the majority of victims in rural and urban areas overdosed on heroin. In rural areas, 50 percent of victims overdosed on heroin, 16 percent on fentanyl, 4 percent on other opioids including pharmaceutical opioids, and the remaining 30 percent were from other drugs, such as bath salts and methadone, or unknown drugs. In urban areas, 55 percent of victims overdosed on heroin, 16 percent on fentanyl, 3 percent on other types of opioids, and 26 percent on other drugs or unknown drugs.
Use of Naloxone
Naloxone is an opioid antagonist medication that is used to reverse an opioid overdose. According to the data, 58 percent of rural overdose victims received naloxone and 42 percent did not. Among urban victims, 69 percent received naloxone and 31 percent did not. The data and accompanying documentation did not provide any explanations on why some victims received naloxone and others did not.
Among rural overdose victims that received naloxone, 55 percent received one dose, 36 percent received two doses, and the remaining 9 percent received three or more doses. Among urban overdose victims that received naloxone, 60 percent received one dose, 33 percent received two doses, and 7 percent received three or more doses.
Naloxone Response
Victim response times after receiving naloxone were reported for 77 percent of victims; 23 percent were recorded as unknown. Among those whose response times were reported, 42 percent of rural and 46 percent of urban victims responded within 3 minutes, 32 percent of both rural and urban victims responded in 4 to 5 minutes, and 25 percent of rural and 22 percent of urban victims took longer than 5 minutes to respond. Naloxone reportedly did not work for 6 percent of rural victims and 4 percent of urban victims.
Overdose Survival Rate
Among naloxone recipients whose outcomes were reported, 92 percent of the rural victims survived the overdose and 8 percent did not. Among urban victims whose outcomes were reported, 93 percent survived the overdose and 7 percent did not.
Among the rural victims who responded to naloxone and survived, 47 percent were reported as responsive and alert, 38 percent were reported as responsive, but sedated, and 15 percent were reported as responsive and angry or combative. Urban victims followed a similar pattern.
Post Overdose Transport
After receiving naloxone and surviving, 55 percent of rural victims were transported to the hospital, 21 percent were transported to treatment, 18 percent refused transport, and 5 percent had other arrangements. Among urban victims, 66 percent were transported to the hospital, 13 percent were transported to treatment, 16 percent refused transport, and 5 percent made other arrangements.
COVID-19 and Overdoses
Although it is too early to draw any meaningful conclusions, it is possible to compare the number of overdose incidents before and during the COVID-19 pandemic. To do this, the Center looked at the number of overdoses between March 19 and May 15, 2020, and compared those to the number of overdoses that occurred during the same period in 2019. (March 19th is the date when Governor Wolf ordered non-life-sustaining businesses to close.)
During the pre-pandemic period in 2019, there were 783 overdose incidents in Pennsylvania. In 2020, during the pandemic period, there were 798 overdose incidents, or a 2 percent increase.
In rural Pennsylvania, there was an increase in the number of overdose incidents between the two periods: 187 incidents pre-pandemic and 256 incidents during the pandemic. In urban Pennsylvania, the number of overdose incidents went from 596 during the pre-pandemic period to 542 during the pandemic period.
Conclusions
Excluding the pre- and post-pandemic comparison of overdose incidents, the data from January 2018 to May 2020 indicate that overdose incidents are similar in both rural and urban Pennsylvania, reinforcing the harsh reality that the opioid crisis is a statewide crisis that knows no geographic boundaries.
Just the Facts: Keep on Scratching
Rural residents are busy buying and scratching €” lottery tickets. According to 2019 fiscal year data from the Pennsylvania Lottery, rural residents spent more than $1.26 billion on lottery tickets, or $374 per resident, and have won $858.2 million in prize money, or $254 per rural resident.
Urban residents have been busy buying and scratching as well, spending more than $3.24 billion on tickets, or $344 per resident, and winning $2.05 billion, or $218 per resident, in total prize money.
In both rural and urban Pennsylvania, per capita lottery ticket sales were negatively correlated with median household income. This means, the lower the household income, the higher the ticket sales.
From 2015 to 2019, rural lottery ticket sales increased at a lower rate than urban ticket sales (5 percent and 11 percent, respectively, after adjusting for inflation).
At the county level, the three counties with the highest per capita lottery ticket sales in 2019 were Cameron, Blair, and Cambria. Each had sales that were greater than $550 per capita. The three counties with the lowest per capita ticket sales were Adams, Chester, and Centre. Each had sales of less than $250 per capita.
Nationwide, the Census Bureau reported that more than $76.3 billion in lottery tickets were sold in 2018, or $233 per capita. The three states with the highest sales per capita were Massachusetts, Rhode Island, and Delaware, each with more than $450 in per capita sales. The three states with the lowest sales per capita were Montana, North Dakota, and Wyoming, each with sales below $57 per capita. For its part, Pennsylvania ranked 12th in the nation in per capita lottery ticket sales with $305 per capita. Six states did not report any lottery ticket sales.