Newsletters
- Home
- Publications
- Newsletter Archive
- Newsletter
May/June 2021
Inside This Issue:
- Center Board Awards Research Grants to Study Pandemic's Impacts on Crime, Education
- Chairman's Message
- Research Provides Overview of PA Public School Transportation
- Center Board Welcomes NPRC President Susan Snelick
- Rural Snapshot: A Look at Youth Employment
- Pennsylvania Wine and Spirits Store Sales: Shaken, Not Stirred
- Just the Facts: Electric Vehicle Registrations
Center Board Awards Research Grants to Study Pandemic's Impacts on Crime, Education
The Center for Rural Pennsylvania’s Board of Directors has awarded three research grants to study COVID-19 and its impact on rural Pennsylvania. The research proposals were submitted as part of a special grant round announced in January 2021. The research projects, which are highlighted below, began in May, and are scheduled to wrap up by the end of the year.
COVID-19 Effects on Pennsylvania’s Crime Trends: A Rural/Urban Comparison
Dr. David Yerger of Indiana University of Pennsylvania and a team of researchers will analyze aggregated, monthly county victimization data, collected from multiple sources by the Pennsylvania Commission on Crime and Delinquency (PCCD) and from Protection from Abuse filings, to describe the effects of the COVID-19 pandemic on victimization across Pennsylvania. The team will also describe any rural-urban differences in crime effects.
Data provided by this project, including long-term trend data that allow for county comparisons and county-level control variables, may help create more accurate statistical measurements (such as seasonal and annual adjustments) and improve information needed by policymakers. A comparison of differences in crime rates and trends by urban vs. rural counties could shed light on future funding needs and reduce potential for urban-biased policy and resource allocation.
Analyzing the Effects of COVID-19 on Educational Equity in Rural Pennsylvania School Districts
Dr. Kai Schafft of Penn State University and a team of researchers will examine how the COVID-19 pandemic has affected educational inequities and school district responses along fiscal, spatial, instructional, and racial/ethnic lines across rural Pennsylvania school districts. The research will use a mixed-methods approach, combining state-level data and local case studies, to inform educational equity policy as the pandemic subsides.
Data provided by this research will contribute necessary information to state and local educational entities on how COVID-19 has affected K-12 education across Pennsylvania’s rural school districts. The research may also inform district policymakers’ efforts as they seek to equitably create a “new normal” in their districts.
Examining the Effects of COVID on Elementary Student Reading Development: A Longitudinal Analysis
Dr. Daniel Wissinger of Indiana University of Pennsylvania and a team of researchers will examine student reading trajectories across 2020-2021 to understand the potential effects of COVID-19 on reading development.
Chairman's Message
A proposal to change the definition of Metropolitan Statistical Areas might not register on most people’s radar, but it certainly caught the Center’s attention.
Earlier this year, the federal Office of Management and Budget (OMB) was proposing to change the minimum population threshold for Metropolitan Statistical Areas, or MSAs, from 50,000 people to 100,000 people.
As I write this message, OMB has not adopted the new definition, and, from the information gathered by the Center at an April public hearing, it would be best if OMB did not go through with the change at this time.
At the hearing, we learned that implementing the new definition would potentially impact 10 counties in Pennsylvania, and almost 1.2 million people living in those counties €“ the highest number of people impacted of any state in the country.
Comments from the hearing panelists, who represented the Brookings Institute, the Pennsylvania State Association of Boroughs, and SEDA-Council of Governments, as well as written comments submitted by the Hospital and Healthsystem Association of Pennsylvania, indicated that this proposed change would have important financial implications for many Pennsylvania municipalities. For example, the change could affect millions of dollars in federal reimbursements for health care, funding for housing, and investments in transportation. For the specifics on these implications, visit the Center’s website where you will find the submitted comments and a recording of the hearing.
We hope that OMB has put the brakes on this definition change for the foreseeable future since it has the potential to have such a significant impact on Pennsylvania. The Center will be sure to continue tracking any announcements on this or other proposed changes at the federal level, and to share that information with you.
Also in April, the board thanked and bid a fond farewell to Dr. Joseph Nairn, who retired as president of Northern Pennsylvania Regional College (NPRC). Dr. Nairn served on the board since 2019, and it was a pleasure working with him. He was a very engaged and dedicated board member, and we will miss his involvement. We wish him all the best in his retirement.
In turn, we welcome Ms. Susan Snelick, NPRC’s new president, to the board. We look forward to working with President Snelick and wish her much success in her new position.
Senator Gene YawResearch Provides Overview of PA Public School Transportation
In Pennsylvania, about 96 percent of rural public school students relied on public school transportation between 2013-14 and 2017-18, according to research conducted by Dr. Liang Xu of Slippery Rock University. The research, sponsored by the Center for Rural Pennsylvania, also confirmed that transporting fewer students over large areas or longer distances drives up the cost per student transported in rural school districts.
Conducted in 2020, the research analyzed Pennsylvania Department of Education data from 2013-14 to 2017-18 to examine changes in public school district enrollment, transportation ridership, and transportation finances at the state, rural, and urban levels. It also calculated changes in the number of transportation service providers to learn more about the current school transportation structure in Pennsylvania.
Overall, from 2013-14 to 2017-18, school enrollment and transportation ridership decreased by 4.6 percent and 5.0 percent, respectively, in rural school districts. Urban school districts saw a 1.3 percent decline in enrollment, and a 1.4 percent increase in transportation ridership. Overall, Pennsylvania experienced a 2.2 percent decrease in school enrollment, and a 0.4 percent decrease in transportation ridership. The enrollment decline was relatively gradual in urban districts but more severe in rural districts.
A downward trend in nonpublic school ridership and an upward trend in charter school ridership co-existed at the state, rural, and urban levels. Rural public school enrollment was lower than total pupils transported during the study period because of nonpublic and charter school student ridership. On average, nonpublic and charter school students accounted for 5.3 percent of total pupils transported in rural school districts and 16.9 percent in urban school districts. On average, about 96 percent of rural public school students relied on public school transportation during the study period.
The continuous decline in enrollment and the steady rise in transportation costs caused a statewide increase of 10.7 percent in costs per student transported over the 5-year period.
On average, the statewide, rural, and urban costs per pupil transported were about $953, $984, and $941, respectively. Rural school districts received 39.5 percent of the total state transportation subsidy over the study period, on average. However, 59.1 percent of rural transportation costs were subsidized by the state.
There were noticeable changes in the structure of school transportation service providers over the 5-year study period. For example, the number of school districts that contracted transportation services with another Local Education Agency (LEA) increased, and the number of school districts that provided LEA-owned transportation services decreased. These two changes indicated that more school districts were seeking independent contractors for all or some of their transportation services during the study period.
The report, An Overview of Pennsylvania Public School Transportation, is available on the Center’s website.Center Board Welcomes NPRC President Susan Snelick
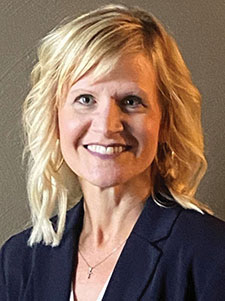
Susan Snelick, president of Northern Pennsylvania Regional College
In April, the Center's Board of Directors welcomed Susan Snelick, president of Northern Pennsylvania Regional College. Ms. Snelick was named president of NPRC in April after the retirement of Dr. Joseph Nairn.
Before she joined NPRC, Ms. Snelick served as the executive director of Workforce Solutions for North Central PA and held various other workforce development leadership positions in the north central region spanning nearly three decades.
Among her professional accomplishments, Ms. Snelick served as the Regional Liaison for the National Association of Workforce Boards, served on the Governor’s Middle-Class Task Force in 2017-2018, participated in the Disney Institute’s Leadership Excellence Program, and chaired the PA Workforce Development Association. She also served on the boards and advisory boards of several educational institutions.
Rural Snapshot: A Look at Youth Employment
About the Data
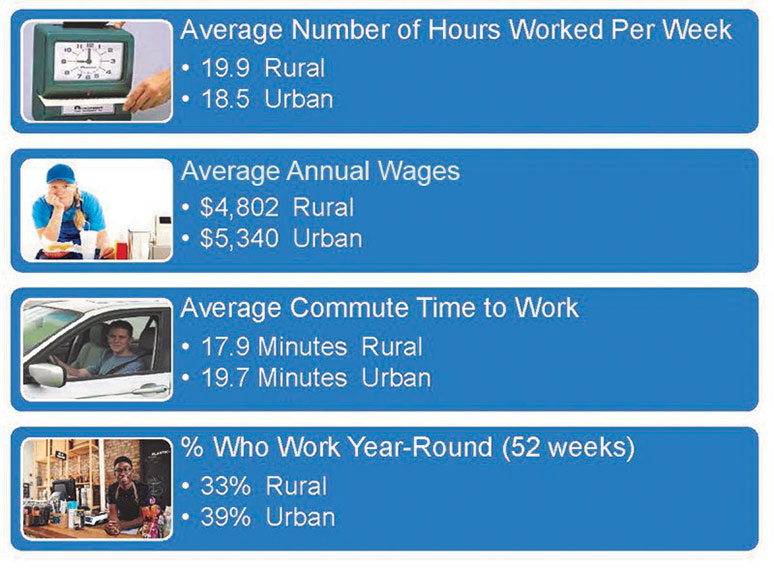
The data include individuals between the ages of 14 and 18 who were employed and were enrolled in the unemployment insurance programs (in Pennsylvania the program is called the Pennsylvania Unemployment Compensation Program). The data exclude individuals who were self-employed or whose employment status was not reported to the unemployment insurance programs.
All data are from the Longitudinal Employer-Household Dynamics, U.S. Census Bureau; 2019 Population Estimates, U.S. Census Bureau; and the 2019, 1-year Average, Public Use Microdata Sample (PUMS), U.S. Census Bureau.
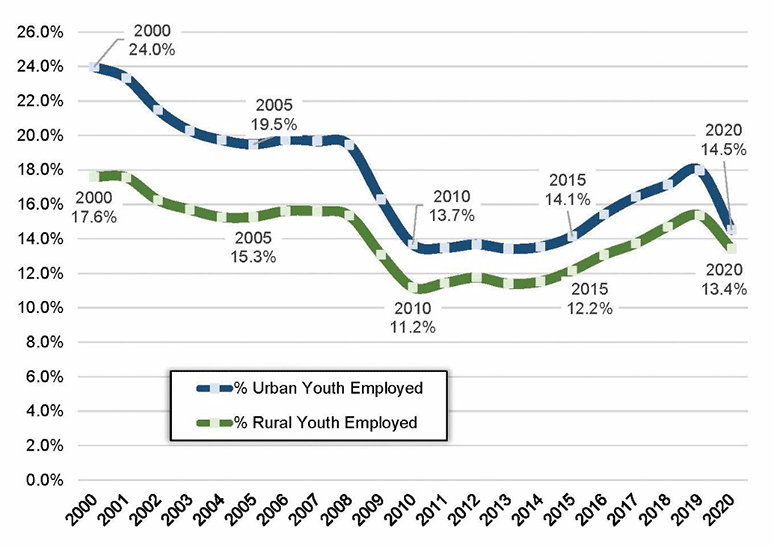
Rural and Urban Youth Employment as Percent of All Youth (Ages 14 to 18), Second Quarters, 2000 to 2020
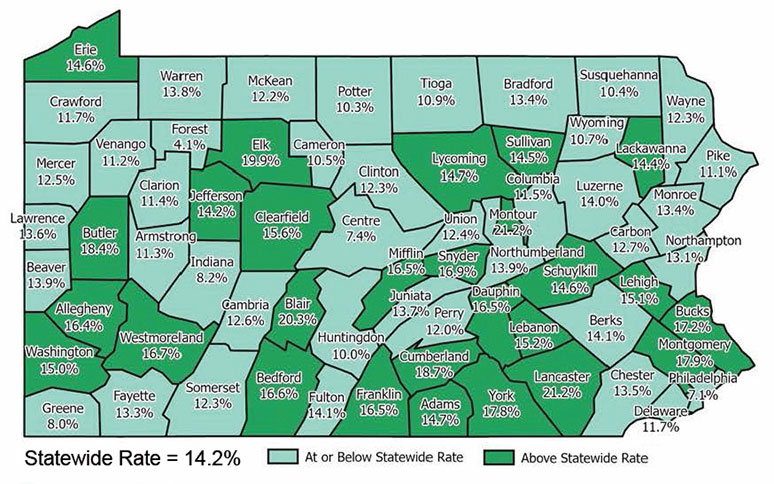
Youth Employment as Percent of All Youth, by County, Second Quarter 2020
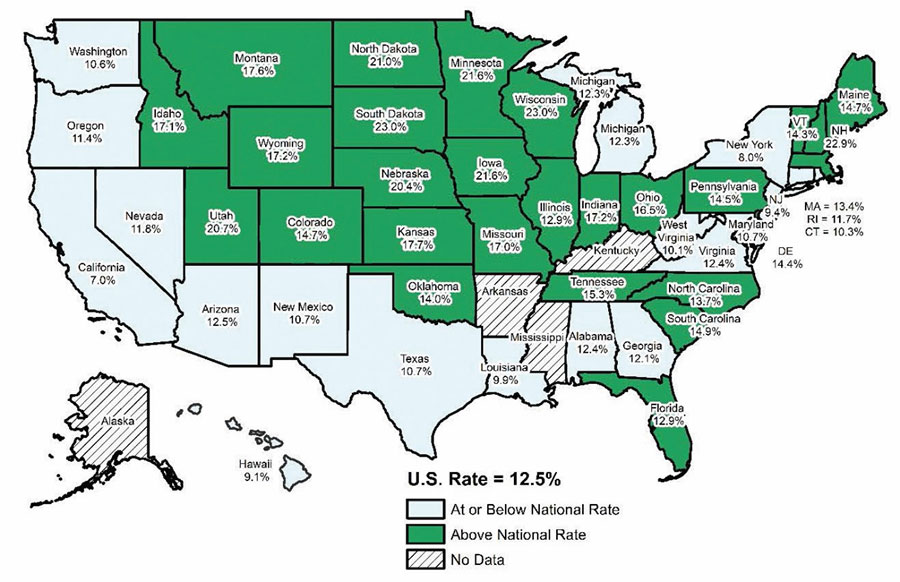
Youth Employment as Percent of All Youth, by State, First Quarter 2020
Profile of Rural and Urban Employed Youth, 2019
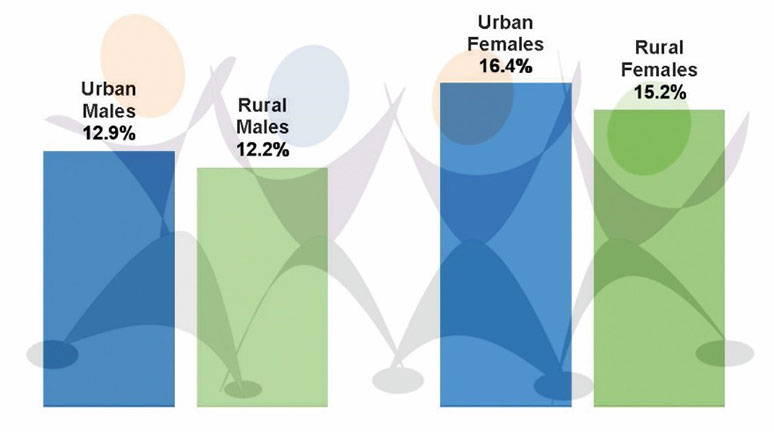
Rural and Urban Youth Employment by Gender, Second Quarter 2020
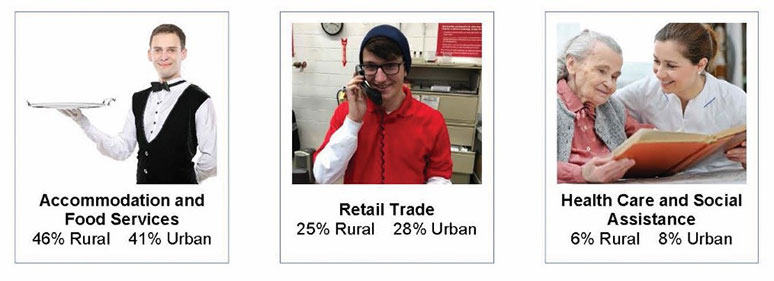
Top Three Industries Employing Rural and Urban Youth, Second Quarter 2020
Pennsylvania Wine and Spirits Store Sales: Shaken, Not Stirred
From fiscal years 2018-2019 to 2019-2020, wine and spirit sales declined across Pennsylvania. This period included the onset of the COVID-19 pandemic. Statewide, sales declined by 19 percent, and the trend held true across rural and urban counties, with declines of 17 percent and 19 percent, respectively.
For the first time in the history of the Liquor Control Board (LCB), stores were closed statewide due to the pandemic. This caused the board to adapt its model of sales by introducing an e-commerce curbside pick-up system where 100 percent of sales occurred from April 20, 2020 to May 7, 2020 through curbside pick up. This trend, however, was short-lived as the phased reopening of various counties allowed in-person transactions.
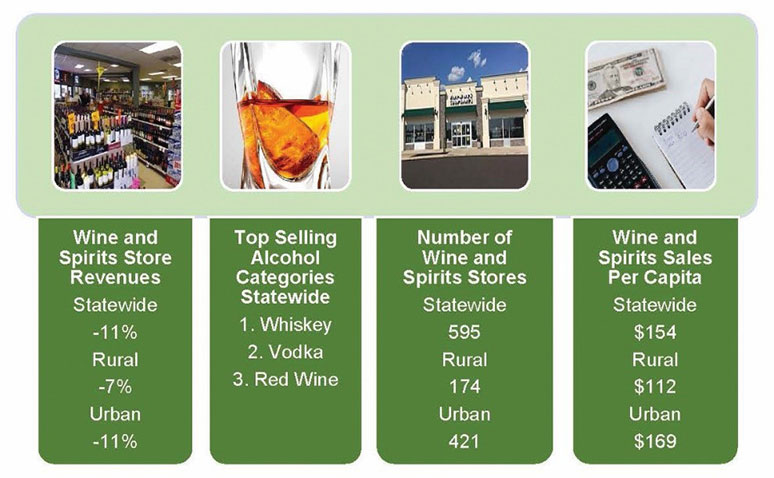
From fiscal years 2019 to 2020, the liquor preferences of Pennsylvanians remained unchanged. The highest percentage of sales was for whiskey, which comprised 21 percent of LCB’s revenues in 2019-2020. In second place was vodka, coming in at 17 percent of sales, followed by red wine at 14 percent of sales. While slightly varied by percentage, these preference ranks were constant across rural and urban counties.
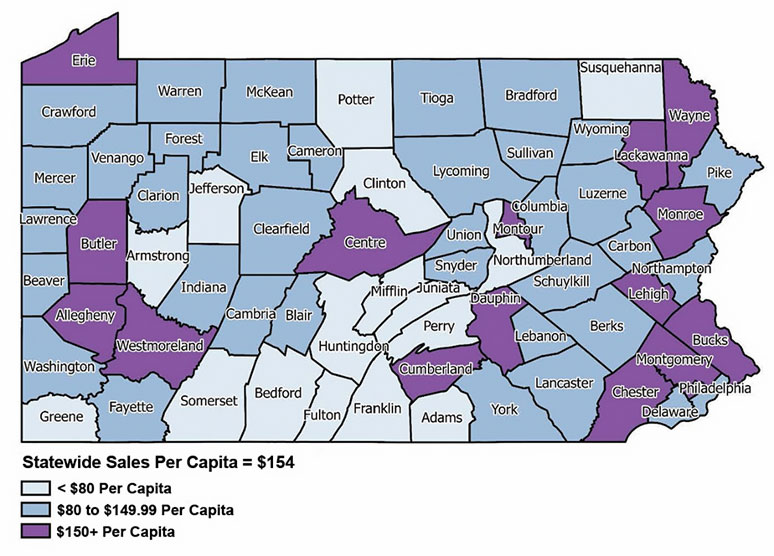
How much did residents spend on these purchases? Rural Pennsylvanians spent $112 per capita on wine and spirits, and urban residents spent nearly $56 dollars more, or $169 per capita. Rural per capita spending was down 7 percent whereas urban spending was down 11 percent.
Across Pennsylvania there are a total of 595 state wine and spirits stores: 174 of these stores are in rural counties and 421 are in urban counties. Twenty-nine percent of stores are in rural counties, and 71 percent are in urban counties. Per capita, there are 5.2 wine and spirits stores per 100,000 rural residents, and 4.5 stores for every 100,000 urban residents. Urban stores brought in more revenue, with $3.8 million per store, on average, compared to $2.2 million per rural store, on average.
Across the U.S., according to the Alcohol and Tobacco Tax and Trade Bureau, taxes received from wine declined 1 percent, and tax receipts from distilled spirits increased 3 percent from federal fiscal years 2019 to 2020.
Wine and Spirits Stores, FY 2018-2019 to 2019-2020
Wine and Spirits Sales Per Capita, FY 2019-2020, by County
Just the Facts: Electric Vehicle Registrations
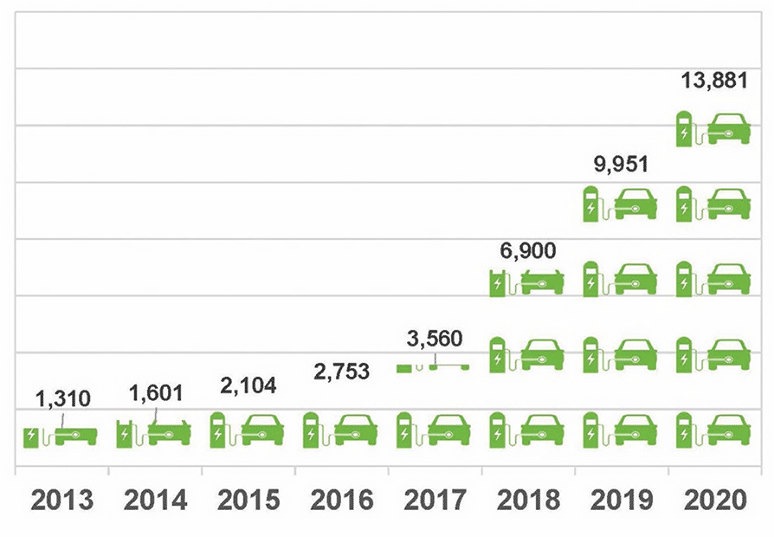
The number of electric vehicle registrations in Pennsylvania have been riding higher, with 2020 registration numbers that are 9.6 times higher than those in 2013.
According to Pennsylvania Department of Transportation data, urban Pennsylvania electric vehicle registrations have outpaced those in rural Pennsylvania. In 2020, 12,098 electric vehicles were registered in urban counties compared to the 1,783 registered in rural counties. Another way of looking at it: that was 17.2 electric vehicle registrations for every 10,000 total vehicle registrations in urban counties and 5.9 for every 10,000 total vehicles registered in rural counties.
The most current national level data from 2018 from the U.S. Department of Energy showed Pennsylvania ranking 17th in the nation in the number of electric vehicles registered. California represented 47 percent of electric vehicle registrations, with approximately 256,800 total registrations.
Federal and state governments have established various tax incentives for consumers to purchase electric vehicles. According to the U.S. Department of Energy, Pennsylvania currently has nine statutory alternative fuel vehicle incentive programs.
Private companies are also incentivizing the purchase of electric vehicles and there are three utility companies in Pennsylvania that provide rebates and incentives for plug-in electric vehicles.
The latest sales data reported by Argonne National Laboratory from March 2021 show that 46,057 plug-in electric vehicles were sold. This figure accounts for 2.9 percent of all vehicles sold in March.
Electric vehicles, like traditional internal combustion engines, need a robust infrastructure of refueling (charging) stations to make everyday use feasible. U.S. Department of Energy data show that Pennsylvania is host to 913 charging stations, with 2,133 individual outlets. Eighty-four percent of these stations are in urban counties and 16 percent are in rural counties. There are 14 counties, all of which are rural, that do not have any reported charging stations.
Electric Vehicle Registration in Pennsylvania, 2013 to 2020
Data Source: Pennsylvania Department of Transportation.
The ABCs of Electric Vehicles
AVE or EV - An all-electric vehicle or electric vehicle gets its energy for driving entirely from its battery. It must be plugged in to be recharged.
HEV - A hybrid electric vehicle does not have the capacity to plug in but has an electric drive system and battery. Its driving energy comes only from liquid fuel.
PHEV - A plug-in hybrid electric vehicle has plug-in capability, and it can use energy for driving from either its battery or liquid fuel.
Data source: U.S. Department of Energy.
