Newsletters
- Home
- Publications
- Newsletter Archive
- Newsletter
May/June 2020
Inside This Issue:
- Hospice Use, Availability in Rural Pennsylvania
- Chairman's Message
- Results: Attitudinal Survey of Pennsylvanians
- Rural Snapshot: Coal Mining Production and Employment
- What is Rural?
- Just the Facts: Elected Women Officials in PA Small Towns
- Fact Sheet Available on Pennsylvania Fire Company Capacity
Hospice Use, Availability in Rural Pennsylvania
Hospice is a form of palliative care that optimizes quality of life by anticipating, preventing, and treating suffering, and is typically delivered within the last six months of life. Research has shown that hospice positively impacts patients’ quality of life, and also mitigates the cost of care at patients’ end of life. Despite these reported benefits, hospice remains underused, with substantial geographic variation in hospice availability and use rates. As there was limited information about hospice availability and use in rural Pennsylvania, Dr. Lisa Kitko, Dr. Joel Segel and Elizabeth Thiede of Penn State University, through a grant from the Center for Rural Pennsylvania, analyzed data from the Centers for Medicare and Medicaid to describe the availability and use of hospice care throughout Pennsylvania. The research was conducted in 2019.
Specifically, the researchers: analyzed the distribution of hospice providers and the number of hospices providing care to rural Pennsylvania counties compared to urban counties; developed a descriptive profile of rural Pennsylvania’s hospice users and drew comparisons between rural and urban Pennsylvania counties; analyzed patient use information to project the number of future hospice users in Pennsylvania counties; and analyzed information collected from interviews with hospice and palliative care providers and administrators to understand the challenges and opportunities for those providing hospice and palliative care.
The research included the following results:
- In Pennsylvania, there was a 4.7 percent decrease in the number of hospice providers from 2017 to 2019;
- About 52 percent of rural hospices are nonprofit, most of which are home health agency-based, and 48 percent are for-profit, most of which are free-standing. The facility types have implications for how care can be delivered, since home-based hospice care requires substantial travel time to a patient’s place of residence for hospice staff, adding to overhead costs for hospices and delaying care for patients residing far from the hospice facility.
- Several rural counties are served by only a single hospice provider, and, in 15 counties, there is no hospice provider physically located in the county;
- In general, rural patients tended to use hospice at lower rates than urban patients. However, in both rural and urban areas, patients who were female, white, age 85 or older, and Medicare Advantage beneficiaries had higher rates of hospice use.
- From 2006 to 2016, Medicare hospice use rates increased in every county except two. Most counties saw double-digit percent increases.
- Assuming similar patterns of hospice use, the research found that there will be significant increases in future hospice demand, based on projections of an aging population in rural Pennsylvania counties. This is particularly important to policymakers as the results of the study interviews also suggested that rural Pennsylvania hospices are already experiencing substantial staffing and provider shortages. Therefore, these staffing and provider shortages may be exacerbated by increasing demand.
- Finally, the interviews with hospice care providers in rural Pennsylvania validated hospice availability and use concerns related to travel time, and lack of choice for patients and families. They also highlighted issues related to using electronic health records in areas with poor internet or cell service.
For a copy of the report, Availability of Hospice in Rural Pennsylvania, click here.
Chairman's Message
Over the past several weeks, together we have faced an unprecedented and truly challenging situation with the onslaught of COVID-19. We’ve all had to adjust our daily habits to deal with a public health pandemic that continues to affect the way we work, learn, interact, and live.
As I write this message, we are five weeks into the now Pennsylvania-wide, stay-at-home order. We’re anticipating that coronavirus infections will decrease in the coming weeks, but we must remain vigilant to the threats of this devastating virus. While some have said that it may be somewhat easier for our rural counties to adapt to and maintain social distancing, as we have lower population densities in our rural counties than our urban counties, we know our rural communities are not immune to this virus and its effects.
Right now, the virus has infected residents in every Pennsylvania county. And several rural counties are showing dramatic increases in unemployment in vital industry clusters.
Before this health crisis spread throughout our commonwealth, the Center for Rural Pennsylvania was sharing research and data on matters of importance to our rural communities. The COVID-19 pandemic has clearly proven how critical these issues are to rural Pennsylvania. Our 2019 report, Broadband Availability and Access in Rural Pennsylvania, documented how the lack of broadband has posed challenges for many communities, such as limiting work and learning at home, and limiting telemedicine capabilities for health care providers and home health service providers. Our research, Examination of Community Health Workers, Exploring Healthcare Alliances in Rural Pennsylvania, and Telehealth in Rural Pennsylvania, have all documented the various challenges of providing health care in rural Pennsylvania, from the limited number of health care providers to the limited number of health care facilities. And, with our extensive database, we have continued to show the trend toward an ever aging population, which we know is more susceptible to virus-related fatalities.
As the limitations of the stay-at-home order are lifted, and we return to what will most likely be an adjusted normal, we know it may be harder for our rural areas to bounce back economically. We’re basing this on our analysis of the rural economy after the 2008 recession, Nine Years and Counting: Rural Pennsylvania’s Economy After the Great Recession.
These data and research results all help to keep a necessary focus on our rural communities, and the resources they need to return to the new normal.
We know that the coming weeks and months will be a difficult time for our commonwealth, and our nation. Stay healthy and safe, and remember to follow the advice of the Centers for Disease Control and Prevention, and the Pennsylvania Department of Health.
Senator Gene Yaw
Results: Attitudinal Survey of Pennsylvanians
In 2019, Penn State University researchers, with a grant from the Center for Rural Pennsylvania, conducted an attitudinal survey of rural and urban Pennsylvanians on a variety of issues. The results of the survey indicated that most respondents in both rural and urban communities had similar attitudes about issues in their local communities, communities across Pennsylvania, and the performance of the government. The following attitudes were most common among both rural and urban residents:
- Rated their local community as “somewhat desirable.”
- Felt that most local community infrastructure issues should receive the “same priority” or “higher priority” in the future.
- Felt that most local community family and human services issues should receive the “same priority” or “higher priority” in the future.
- Were “more or less satisfied” with the way things are going in Pennsylvania today.
- Felt that most issues concerning protection and effective use of natural resources should receive the “same priority” or “higher priority” in the future.
- Held the same viewpoint on a wide variety of current policy issues, including investing in renewable energy resources, implementing a natural gas severance tax, regulating the natural gas industry, legalizing recreational marijuana, implementing a graduated state income tax, keeping the death penalty, arming trained faculty and staff in schools, and expanding methadone clinics.
- Had “some” trust and confidence in the state legislature, the courts, the governor, local and municipal officials, and local school district officials.
- Rated their local government as “fair” or “good” on most characteristics.
Several differences were observed in rural and urban attitudes. One key difference was that rural respondents identified the availability of jobs as the most important issue while urban respondents identified maintenance of roads and bridges as the most important issue.
Also, rural and urban residents disagreed on how to best address the opioid crisis. Rural respondents supported stricter enforcement of criminal penalties, while urban respondents supported increased funding for programs to treat and prevent addiction. Urban respondents supported the expanded availability of methadone clinics, and rural respondents were split as to whether they supported or opposed expanded availability.
Finally, while relatively few respondents identified expanding broadband internet access as needing to receive a “higher priority” from state government, the proportion who said this nearly doubled in comparison to a similar survey in 2008, so its importance has increased among respondents. Furthermore, access to the internet was significantly related to attitudes on many issues. Those without internet access at home felt that their communities were less desirable, were less satisfied with the way things are going in Pennsylvania today, and had less trust in government officials and institutions.
For a copy of the full results, Attitudinal Survey of Pennsylvanians, 2019, click here.
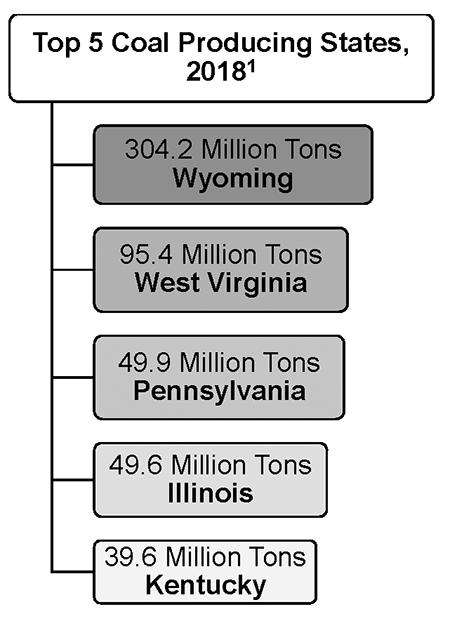
Rural Snapshot: Coal Mining Production and Employment
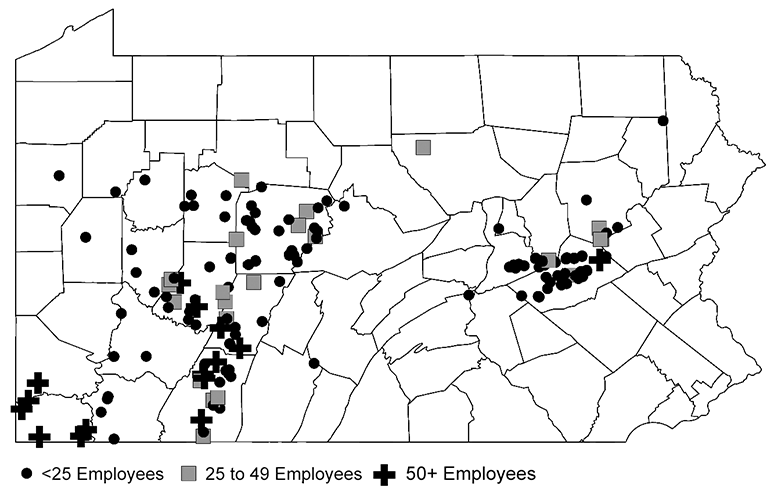
Coal Mines by Location and Employment, 20181
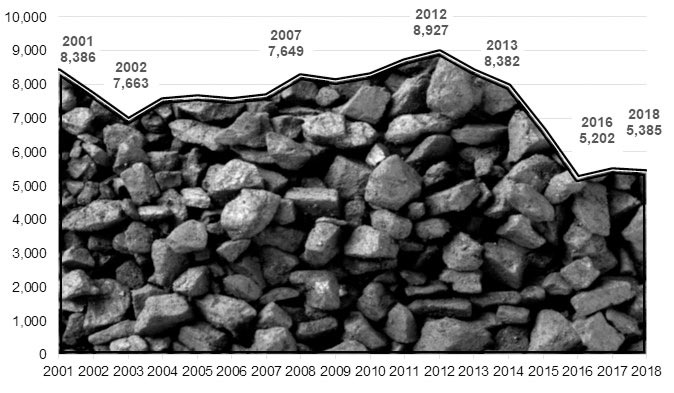
Coal Production in PA and U.S., 2001 to 20181
(In million tons, graph not to scale)
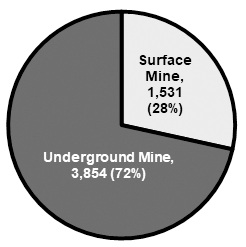
Average Annual Employment in Pennsylvania by Type of Mine, 20181
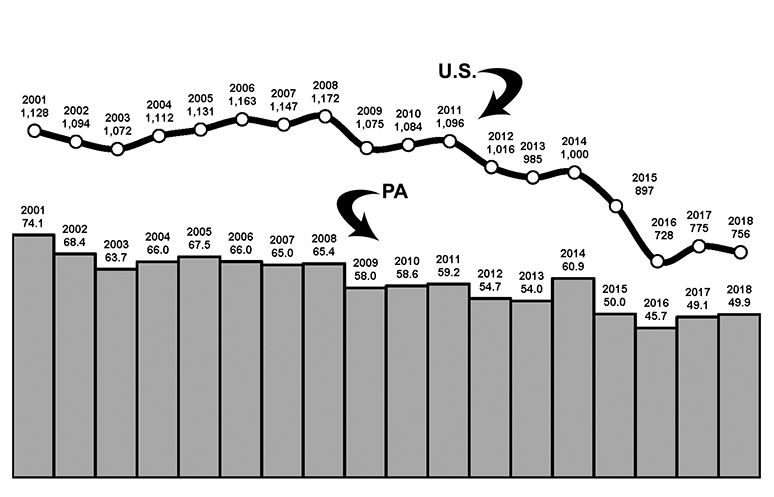
Average Annual Coal Mine Employment in Pennsylvania, 2010 to 20181
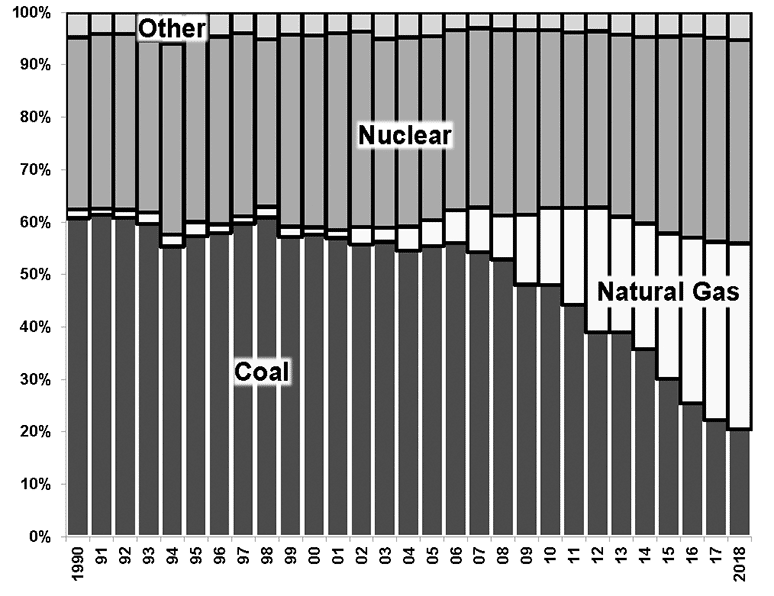
Energy Sources Used to Produce Electricity in Pennsylvania, 1990 to 20182
Number of Pennsylvania Homes Using Coal or Coke for Heat, 1970 to 20183
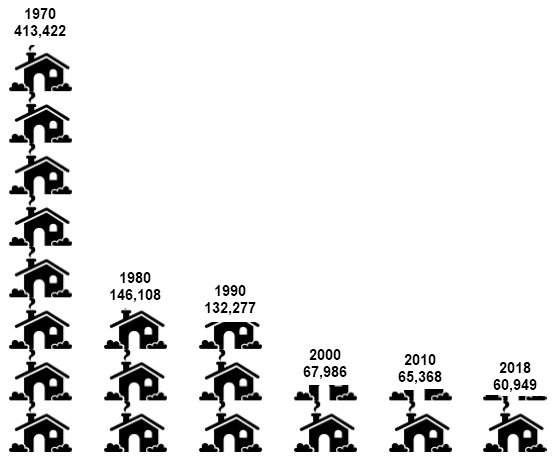
Note: All ton production is measured in short tons (2,000 pounds). 1. Data source: U.S. Energy Information Administration. 2. Other includes hydroelectric, renewable sources, petroleum and other sources. All sources measured in generation megawatt hours. Data source: U.S. Energy Information Administration. 3. Data sources: IPUMS NHGIS, University of Minnesota, and the 2010 and 2018, 5-year Average, American Community Survey, U.S. Census Bureau.
What is Rural?
What is the definition of rural?
There is no one definition of rural. At the federal level, there are no fewer than seven definitions of rural and urban. Each definition is accurate, but each measures different aspects of rural and urban. Most federal definitions begin by defining what is urban; everything else is then considered rural.
What are some of the common federal definitions of rural?
The two most commonly used federal definitions are from the Office of Management and Budget (OMB) and the Census Bureau. OMB’s definition defines Core Base Statistical Areas as cities and counties that are comprised of Metropolitan Areas (50,000 or more residents) and Micropolitan Areas (10,000 to 49,999 residents). Everything else is often referred to as Non-Metro Areas. The Census Bureau uses the terms Urbanized Areas (Census Blocks that are joined together and have a combined population of 50,000 or more), and Urban Clusters (Census Blocks joined together that have a population of 2,500 to 49,999): everything else is rural.
How does the Center for Rural Pennsylvania define rural?
In 2003, the Center’s board adopted a population density model to identify rural and urban counties, school districts, and municipalities. Population density is the population divided by the number of square land miles. According to the 2010 Census, Pennsylvania had a total population of about 12.7 million residents, and 44,743 square land miles, making its population density 284 people per square mile. Counties and school districts that have population densities below this number are defined as rural. Those with population densities at or above this number are defined as urban.
What about municipalities?
The municipal definition is a bit more complicated. The Center defines a municipality as rural when the population density within the municipality is less than the statewide average density of 284 people per square mile, or the total population is less than 2,500, unless more than 50 percent of the population lives in an urbanized area as defined by the U.S. Census Bureau. All other municipalities are considered urban.
What are the numbers of rural/urban counties, school districts, and municipalities?
There are 48 rural counties and 19 urban counties; 235 rural school districts and 265 urban school districts; and 1,592 rural municipalities and 970 urban municipalities.
Will the Center for Rural Pennsylvania update it definition?
Yes, when the results from the 2020 Census are released in 2021, the Center will re-calculate Pennsylvania’s population density, and then update its county, school district, and municipal rural/urban definitions.
Click here for more information.
Pennsylvania County Population Densities Per Square Mile
(Rural counties are in bold)
Adams 196
Allegheny 1,676
Armstrong 106
Beaver 392
Bedford 49
Berks 480
Blair 242
Bradford 55
Bucks 1,035
Butler 233
Cambria 209
Cameron 13
Carbon 171
Centre 139
Chester 665
Clarion 67
Clearfield 71
Clinton 44
Columbia 139
Crawford 88
Cumberland 432
Dauphin 511
Delaware 3,041
Elk 39
Erie 351
Fayette 173
Forest 18
Franklin 194
Fulton 34
Greene 67
Huntingdon 52
Indiana 107
Jefferson 69
Juniata 63
Lackawanna 467
Lancaster 550
Lawrence 254
Lebanon 369
Lehigh 1,013
Luzerne 360
Lycoming 95
McKean 44
Mercer 173
Mifflin 114
Monroe 279
Montgomery 1,656
Montour 140
Northampton 805
Northumberland 206
Perry 83
Philadelphia 11,379
Pike 105
Potter 16
Schuylkill 190
Snyder 121
Somerset 72
Sullivan 14
Susquehanna 53
Tioga 37
Union 142
Venango 82
Warren 47
Washington 243
Wayne 73
Westmoreland 355
Wyoming 71
York 481
Just the Facts: Elected Women Officials in PA Small Towns
Pennsylvania had more than 12,700 elected municipal officials in 2018. Less than one-fifth of these officials were women.
According to a 2018 survey of municipal officials conducted by the Center for Rural Pennsylvania, female elected officials were 61 years old, on average, and had been in office for 9 years. Their male counterparts were 62 years old, on average, and had been in office for 12 years.
A higher percentage of female officials had a bachelor’s degree or higher than male officials (38 percent and 26 percent, respectively.) Female officials were less likely to have attended a municipal training class in the previous 2 years (39 percent) than male officials (52 percent).
On the home front, both female and male officials had roughly the same number of people living in their households (average of 2.3) and about the same percentage had young children living in their households (15 percent). There was, however, a difference in the number of years they have lived in the municipality: 73 percent of female officials lived in their municipalities for 20 years or more, compared to 80 percent of male officials.
A slightly higher percentage of female officials (62 percent) were in the labor force than male officials (59 percent). In terms of income, there was no significant difference between females and males; 64 percent of female officials had incomes of $50,000 or more compared to 62 percent of male officials.
In addition to their municipal responsibilities, a higher percentage of female officials volunteered in their communities (81 percent) than male officials (72 percent).
In their last election, 51 percent of female officials and 45 percent of male officials said another candidate ran against them.
In the survey, municipal officials were asked why they initially ran for local office. For the most part, the motivation to run for local office did not vary by gender. The top three reasons why both female and male officials initially ran for office were: a desire to be active in the community, encouragement from others, and a desire to improve their local areas.
For the fact sheet, Elected Women Officials in Pennsylvania Small Municipalities, click here.
(Note: The survey was mailed to elected municipal officials in municipalities with fewer than 2,500 residents. The statewide survey was sent to a random sample of borough and township officials and had a response rate of 33 percent, with a margin of error of +/-2.6 percent.)
Fact Sheet Available on Pennsylvania Fire Company Capacity
The Center has released a fact sheet, Pennsylvania Fire Company Capacity, 2012 and 2019, which is available here. It is the second in a series based on a 2019 survey of Pennsylvania fire chiefs from volunteer fire companies and combination paid/volunteer companies. The Center conducted the survey in partnership with the Pennsylvania Fire and Emergency Services Institute (PFESI).
The Center compared the results of the 2019 survey with the results of a similar survey of fire chiefs conducted in 2012.
The 2019 survey results indicated that:
- Fire companies had 24.1 active members, on average, which is a 3 percent decrease from 2012;
- 45 percent of fire companies had operating budgets under $100,000;
- 13.9 is the average number of fundraising events fire companies sponsor, which is a decrease from 2012 when companies sponsored 17.6 events, on average.
- 688 is the average number of calls fire companies responded to over the previous 2 years, which is a 22 percent increase from 2012;
- 56 percent of fire chiefs said their companies were unable to respond to some calls over the previous 2 years €“ in 2012, 44 percent said the same;
- 39 percent of fire companies have strategic plans; and
- 34 percent of companies discussed or considered consolidation over the previous 2 years.
