Newsletters
- Home
- Publications
- Newsletter Archive
- Newsletter
March/April 2020
Inside This Issue:
- Everyone Counts in Pennsylvania: Census 2020 is Here
- Chairman's Message
- Growing Pennsylvania's Hard Cider Industry
- Rural Snapshot: Firefighter Recruitment and Retention
- Research Identifies Challenges, Opportunities for Pennsylvania Senior Community Centers
- Just the Facts: Federal Tax Filers
Everyone Counts in Pennsylvania: Census 2020 is Here
On April 1, 2020, the U.S. Census Bureau will be counting all residents living in the U.S. We encourage all Pennsylvanians to answer the Census and be counted!
The Census is important because it will determine congressional representation, is the basis for hundreds of billions in federal funding, and provides data that will impact communities for the next decade.
According to the U.S. Census Bureau, 95 percent of households will receive their census invitation in the mail, and the remaining 5 percent will get their census invitation delivered by a census taker working for the bureau. If you’re visited by a census worker, ask to see the worker’s identification. The person should have an official identification badge with a photo, U.S. Department of Commerce watermark, and an expiration date. If you have questions about the person’s identity, you can call 1-800-923-8282 to speak with a local U.S. Census Bureau representative. If the visitor who came to your door is not with the bureau, call your local police department. Census workers will not ask for your social security number (SSN), bank or credit card information, money or donations, or anything on behalf of a political party. If someone claiming to be from the U.S. Census Bureau contacts you via email, phone, or in-person and asks for any of this information, it’s a scam. If you answer the census online, make sure the website address begins with “HTTPS” and includes a lock symbol. You should know that the information you provide as part of the Census can never be used against you. It’s the law. Under Title 13 of the U.S. Code, the U.S. Census Bureau cannot release any information about you or others in your household. Your Census answers can only be used to produce statistics.
And your responses are safe. The Census Bureau has a team of cybersecurity experts monitoring and protecting the bureau and your data. If a census worker helps you fill out your census form in-person, the worker is using technology that meets the same federal security standards.
Your response matters. You might be living in an apartment, house, group housing situation (like a dorm or nursing home). You might be experiencing homelessness. Regardless of your living situation, you count. It also doesn’t matter what your citizenship status is, how old you are, or your gender. If you live here, you matter to Pennsylvania and the Census. For more information about the Census, click here.
Chairman's Message
Now is the time! The 2020 Census is underway, and I urge you to fill out your Census form. Please encourage relatives, friends and neighbors to fill out and return their forms as well. As I mentioned in the last issue of Rural Perspectives, the 2020 Census will provide a snapshot of our nation’s population, and the results are vitally important to our state. This once-a-decade federal requirement generates information that helps businesses, researchers, and communities make important decisions. It also determines congressional representation, and is used to direct hundreds of billions in federal funding to communities nationwide for hospitals, fire departments, school lunch programs, and other critical programs and services. So please, take the time to be counted.
On behalf of the Center, thank you to the fire chiefs across the state who participated in the Center’s Pennsylvania fire chief survey late last year. This survey was conducted in partnership with the Pennsylvania Fire and Emergency Services Institute (PFESI), and was the third such survey we conducted with PFESI since 2001. The results of these surveys help us to understand the state of volunteer fire services in Pennsylvania, and the efforts volunteer fire companies put forth to maintain firefighting services in our communities. A quick snapshot of the 2019 results is on Pages 4 and 5, and you can download the more in-depth results here.
We’re also sharing the results of two research projects that speak to the wide range of issues that are important to Pennsylvania €“ agriculture and senior services.
The research on the emerging hard cider industry in Pennsylvania provides a detailed overview of the industry’s past and present, and its future potential impact on agritourism. The findings may help our apple producers participate in additional value-added agriculture.
The research on senior community centers in rural and urban Pennsylvania examined center services, attendance, program participation, transportation options, and more. This research notes that, as Pennsylvania’s population ages, and as more baby boomers tap into the services provided by these centers, the centers will need more flexibility and support to be responsive to the needs of their constituents.
In January, the Pennsylvania Certification Board announced a certification program for Community Health Workers (CHW). With current shortages of health care professionals in rural Pennsylvania, CHWs can play a significant role in the delivery of health services. Recognizing this, the Center for Rural Pennsylvania published research in 2017 addressing the role of CHWs. Findings from the research supported efforts to establish formal training requirements and a certification program. This is another example of the Center focusing its work on timely and important issues facing rural Pennsylvania.
Senator Gene Yaw
Growing Pennsylvania's Hard Cider Industry
Craft breweries have been at the forefront of a food and drink movement where consumers want alternative options with new flavors and locally sourced ingredients. While hard cider (called cider from here on) represents a small portion of the overall alcohol industry, it has been experiencing tremendous growth.
To provide a better understanding of the state’s cider industry, including production and consumption, Dr. Alison Feeney of Shippensburg University answered a variety of questions about this brewed beverage and developed policy considerations that may help to build the industry and strengthen its potential to grow sustainable agritourism in Pennsylvania.
The research used a variety of methods to assess the definition of cider, who produces it, how it’s marketed to the public, and what experiences are available to consumers to learn about, sample, and purchase cider.
The research noted that one area of confusion with cider relates to the legal definition, licensing, and regulation of the product. While cider is categorized as a still wine at the federal level, it is considered a brewed beverage in Pennsylvania. Most breweries, however, don’t produce cider. Instead, limited winery licensees produce the majority of cider in the state.
Legislative changes at both the state and federal levels regarding taxes, ingredients, and alcohol and carbon dioxide levels made taxes paid on cider similar to those for craft beer. While these changes helped to increase cider production, Pennsylvania is still only ranked 16th nationwide for cider production: even though it is the 4th largest apple producing state in the nation.
The research indicated that, if Pennsylvania created a farm license similar to neighboring states, such as New York, Maryland, and Virginia, small apple orchards would be able to use the remainder of their crops, which might not sell in grocery stores or at farmers’ markets, to produce cider.
To learn how cider is marketed in Pennsylvania, the research conducted a quantitative content analysis of the 53 official Pennsylvania tourism promotion agency websites.
Artisan beverages were prominently featured as tourist activities. While cider was promoted by many agencies, without a consistent framework of where and how to include the beverage, it was inconsistently placed with beer, wine, and/or spirits. In contrast, Virginia and Oregon provide clear descriptions on their states’ webpages of what cider is, the importance of the beverage to each state’s heritage, agriculture, and economy, places to sample it, and suggestions of what other activities can be enjoyed nearby. If Pennsylvania defined cider at the state level, it could provide a framework for city, county, and regional tourism agencies to promote local businesses. Consistency on how cider is promoted between agencies also would allow tourists to find similar venues in different locations.
Since cider can be produced in Pennsylvania by those with a brewery or winery license, the researcher was unable to determine the exact number of producers in the state: so, the research focused on companies that actively promoted themselves as cider producers.
Via website reviews and on-site visits, the researcher found that only half of cider producers in the state had a tasting room open to the public; on average, they were open fewer hours and days a week than breweries, wineries or meaderies.
The research also found that Pennsylvania lacks a large cider venue, like New York with Angry Orchard, or Virginia with Bold Rock, to draw visitors and encourage additional visits to surrounding cider makers. Other efforts to promote the industry in neighboring states include official state road signs to encourage travel and help tourists identify small artisan beverages made on farm properties.
Many areas in the Mid-Atlantic are taking advantage of the growth in artisan beverages, and Pennsylvania has the potential to become a cider tourism hub.
With some adjustments to legislation, regulations, and marketing, and better coordination among tourism promotion agencies and cider producers, Pennsylvania’s cider industry could flourish, and help support sustainable agritourism.
For a copy of the report, Pennsylvania’s Emerging Cider Industry and Its Contribution to Artisan Beverages and Sustainable Agritourism, click here.
Rural Snapshot: Firefighter Recruitment and Retention
This Snapshot shares some of the results from a 2019 survey of Pennsylvania fire chiefs conducted by the Center for Rural Pennsylvania and the Pennsylvania Fire and Emergency Services Institute. The mail survey of fire chiefs of both volunteer and combination volunteer/paid companies helped to identify firefighter recruitment and retention patterns across Pennsylvania. The Center compared the results of the survey to similar surveys conducted in 2012 and 2001. For the fact sheet, Recruitment and Retention of Pennsylvania Firefighters, 2019, which includes the survey methods, limitations, and results, click here.
Survey Response Rates

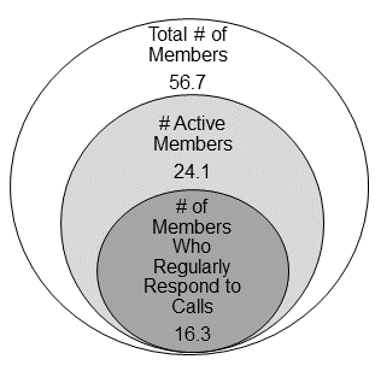
Average Number of Fire Company Members, 2019
In 2019, fire companies had, on average, 56.7 total members, 24.1 active members, and 16.3 members who regularly responded to calls. Fire companies located in rural counties had, on average, fewer active members (22.5) than those in urban counties (25.7).
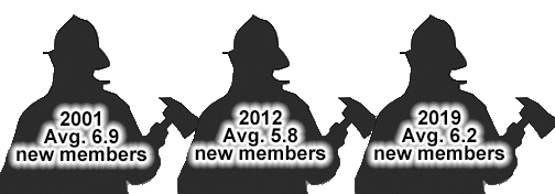
Average Number of New Fire Company Members Over the Previous 2 Years, 2001, 2012 and 2019
In 2019, 94 percent of fire chief respondents said new members joined their company. On average, these companies gained 6.2 new members. This was a slight decrease from 2001, when 6.9 new members, on average, joined the fire company. Urban fire companies had more new members, 6.8 on average, than rural companies, 5.5 on average.
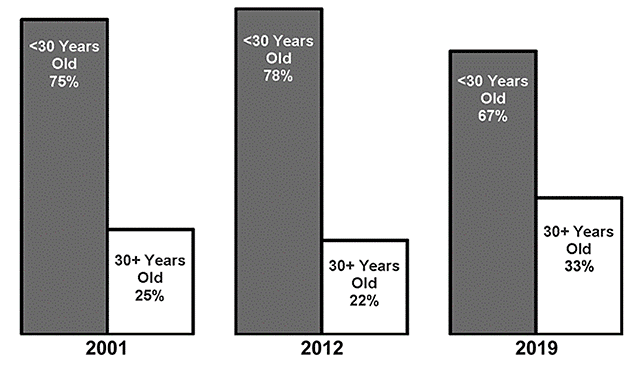
Age of New Members, 2001, 2012, and 2019
In the 2019 survey, fire chiefs were asked to identify the barriers to recruitment. The top two barriers were time commitment and an aging population. One in five chiefs said they had no formal program for recruitment. Rural fire chiefs were more likely to point to population loss and an aging population as recruitment barriers than urban chiefs.
Recruitment Methods Used to Attract New Members, 2001, 2012, and 2019
(Totals do not add up to 100 percent due to multiple responses)
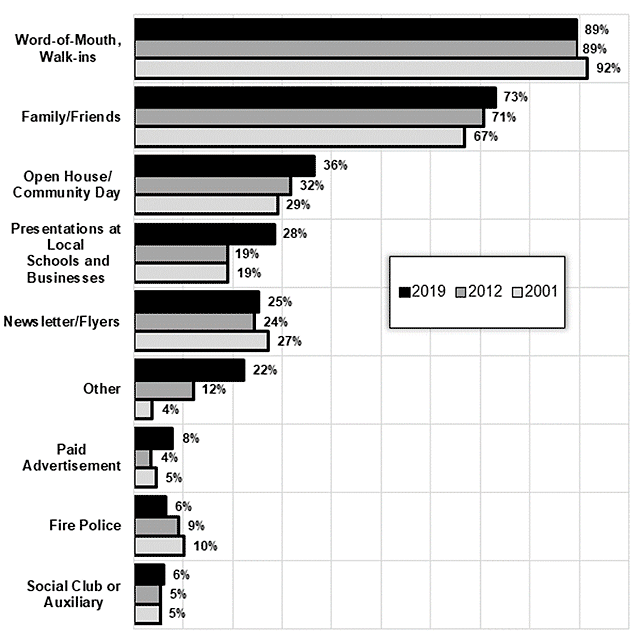
In 2019, the top three methods for recruiting new members were:
- word-of-mouth/walk-in (89 percent);
- family/friends (73 percent); and
- open house/community day (36 percent).
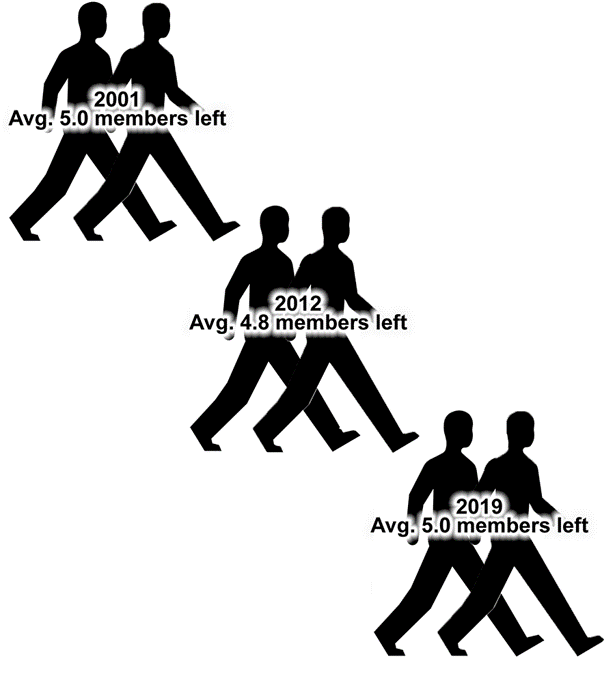
Average Number of Members Who Left the Fire Company Over the Previous 2 Years, 2001, 2012 and 2019
Over the Previous 2 Years, 2001, 2012 and 2019 In 2019, five active firefighters, on average, left the fire company. This rate is identical to the 2001 rate, and only slightly above the 2012 rate of 4.8 members.
In 2019, the top three reasons why members left the fire company were:
- employment commitments (60 percent);
- moved away from the area (59 percent); and
- family commitments (48 percent).
These were the same top three reasons in the 2001 and 2012 surveys.
Research Identifies Challenges, Opportunities for Pennsylvania Senior Community Centers
Pennsylvania’s senior population has grown more than 10 percent from 2010 to 2018. In 2018, 19 percent of the state’s rural population and 17 percent of its urban population was 65 years old and older.
According to the National Council on Aging, senior community centers are some of the most widely used services among American seniors.
There are senior community centers (SCCs) in every Pennsylvania county that serve residents who are 55 years old and older.
To analyze the challenges and opportunities that these centers face in providing services to a growing senior population in Pennsylvania, researchers from Pennsylvania State University and Keystone College created an inventory of Pennsylvania’s rural and urban SCC locations, including the types of services provided and activities available, and analyzed SCC attendance and program participation, accessibility/access issues, means of transportation to/from the center, and relevant demographic characteristics.
The researchers, Dr. Janet Ann Melnick and Dr. Heather Shanks-McElroy, also identified innovative and successful models that SCCs are using to provide services to older adults in Pennsylvania, including those focusing on transportation, nutrition, and social activities.
The researchers also formulated policy considerations regarding the development, growth, and maintenance of SCCs in Pennsylvania.
SCC participation and programming
The research found that more than 122,100 individuals age 55 years and older, or 3 percent of the projected over-55 population in Pennsylvania, participated in SCC programming in 2017.
Participants accessed a wide variety of programs, including congregate meals, health and wellness programs, group and recreational programs, and, at a few centers, personal care services. In general, participants are independent and active individuals who go to SCCs for the activities they enjoy.
To assess the strengths and weaknesses of current SCCs, the researchers surveyed SCCs and also conducted five focus groups. SCC participants who completed the online survey were also asked to identify innovative programming within their centers.
The research found that innovative programming occurs regardless of the center’s location, size, or participant characteristics. Innovation was noted when centers were responsive to the needs and wants of their constituents. The research indicated there is no one model, or one-size-fits-all description, of innovation.
The research found that the lack of flexibility was the biggest impediment to SCC operations and growth. The areas most impacted by inflexibility were SCC funding, transportation, meals, staffing, and Pennsylvania Department of Aging reporting requirements.
The research also found that centers lack the ability to share program ideas and find information across centers, whether regionally or across the state. The researchers suggest that if the state were to assist centers in this area, it would not only encourage and support innovation in SCC programming, but also provide a vehicle for consistent sharing of information that is currently lacking.
Finally, the research identified important policy considerations for the Pennsylvania Department of Aging that could help enhance and further support SCCs. These include improved transportation service provision, revitalization of congregate meal offerings, funding, program flexibility, staffing, the sharing of information across programs on a regional and state level, and a centralized marketing initiative to promote SCCs across the state.
Research report available
For a copy of the report, Evaluation of Senior Community Centers in Rural and Urban Pennsylvania, click here.
Just the Facts: Federal Tax Filers
Tax season is here, and across the commonwealth, millions of Pennsylvanians are filing their federal income taxes.
According to the Internal Revenue Service (IRS), there were 1.59 million rural federal taxpayers and 4.64 million urban taxpayers in 2017. From 2013 to 2017, the number of rural federal taxpayers declined slightly (0.2 percent), and the number of urban taxpayers increased 2 percent.
In both rural and urban areas, the majority of taxpayers received a refund. In 2017, 79 percent of rural taxpayers and 77 percent of urban taxpayers received a refund. The average refund for rural taxpayers was $2,574. The urban average was $2,830, or $250 more than the average rural refund.
From 2013 to 2017, the average refund for rural taxpayers and urban taxpayers declined 3 percent and 6 percent, respectively.
According to the IRS data, the highest increases in the number of federal tax refunds were among those with taxable income of $100,000 or more. For example, 59 percent of rural taxpayers in this income bracket received $4,918, on average, in refunds. In urban areas, 56 percent of taxpayers with $100,000 or more in income received $5,588, on average.
From 2013 to 2017, the number of higher income taxpayers in rural and urban Pennsylvania increased more than 21 percent.
After filing, some taxpayers still owed money. In rural areas, 15 percent of taxpayers owed $4,334, on average, and 18 percent of urban taxpayers owed $5,799, on average.
From 2013 to 2017, there was a 15 percent increase statewide among taxpayers who owed taxes. These averages were skewed by higher income taxpayers (those who earned $100,000 or more). For example, 35 percent of higher income rural taxpayers owed $10,069, on average, after filing their taxes, and 37 percent of higher income urban taxpayers owed $11,781, on average, after filing.
