Newsletters
- Home
- Publications
- Newsletter Archive
- Newsletter
November/December 2017
Inside This Issue:
- Community Health Workers' Role in Health Care Delivery
- Chairman's Message
- State of Addiction Public Hearing
- Rural Snapshot: Health Insurance
- Decline in Retail Establishments and Employment
- Just the Facts: Living on the Road
Community Health Workers' Role in Health Care Delivery
With current shortages of health care professionals in rural Pennsylvania, community health workers have the potential to play a significant role in the delivery of rural health services, according to research out of Lock Haven University of Pennsylvania. Currently, there is no single definition of a community health worker (CHW). However, the research used the definition from the Human Resources and Services Administration’s Community Health Workers National Workforce Study, which defines CHWs as lay members of communities who work or volunteer with local physical health and/or mental health care systems and usually share ethnicity, language, socio-economic status, and life experience with the community members they serve.
The research used surveys, focus groups and leadership interviews to collect information on: the age, gender, educational background, type of employment, tasks and work hours of CHWs; current job descriptions; populations served; training; health issues of patients; and other pertinent factors.
The research was conducted in 2016 and 2017 by Dr. Darlene Ardary, Dr. Jennifer DellAntonio, Dr. Steven Granich, Dr. Lynette Reitz, Dr. Andrew Talbot and Joyce Du Gan to gain an understanding of community health workers (CHWs) in rural Pennsylvania. The research was sponsored by the Center for Rural Pennsylvania.
Research results
Results from the surveys, interviews, and focus groups found that CHWs work or volunteer in a variety of agencies and serve a wide range of populations in rural Pennsylvania. Their duties range from working with the elderly to working with infants and children. Depending on the agency and work status, CHW caseloads can be very different. Thirty-nine percent of CHW survey respondents said they had 31 or more cases a month.
According to the CHW survey, 91 percent of CHWs are female, with an average age of about 48. CHWs have worked or volunteered in the field for 9 years, on average, with 76 percent of the respondents being paid workers. The educational background of CHWs varied, and ranged from a high school education to a college degree.
Twenty percent of CHWs earn between $20,000 and $30,000 per year. It was evident from the focus groups and leadership phone interviews that low pay, high turnover, and lack of adequate funding were significant issues for many agencies.
According to the CHW survey, 89 percent of respondents received some type of training to be a CHW. It was evident from the leadership interviews and focus groups that there was a variety of training opportunities being offered to CHWs, depending on the work setting and whether they were volunteer or paid workers. On-the-job training, conference training, certificate programs, shadowing, and formal education were the predominant types of training.
Overall, the research provides an overview of CHWs in 37 rural Pennsylvania counties. While the research was limited by the lack of a clear definition of CHWs, it found that there is currently no official certification process for this job category or standardization of the position. It also found that the number of CHWs is limited by a lack of funding sources. In the medical health care field, CHWs do not have a large source of funding, while in the mental health field, field peer specialists receive Medicaid money and county/state funds.
The research provides several policy considerations for the state legislature and state health and human services agencies. The first concerns the decision on whether CHWs should be certified in Pennsylvania. Others relate to funding solutions to allow CHWs to further assist community members with accessing care.
A copy of the research report, Examination of Community Health Workers in Rural Pennsylvania, is at www.rural.palegislature.us.
Chairman's Message
This year marks the Center for Rural Pennsylvania’s 30th year of service to the Pennsylvania General Assembly and to Pennsylvania’s rural communities.
Over the past 30 years, the Center has been honored to work with many knowledgeable and dedicated faculty and administrators at the 14 Pennsylvania State System of Higher Education universities, Pennsylvania State University, and University of Pittsburgh branch campuses to research issues that impact our state’s nearly 3.5 million rural residents.
The Center’s research speaks to the widening scope of issues affecting our rural communities, including community and economic development, the growth of healthcare alliances, flood mitigation, special education enrollment and funding, Marcellus Shale development, domestic violence services, homelessness, the financial viability of volunteer fire companies, telehealth services, potential minimum wage increases, and the heroin/opioid epidemic. As always, the goals of our research have been to provide a practical understanding and knowledge of rural Pennsylvania and to identify program and policy options that can have meaningful impact for our state’s rural residents.
Through the Center’s ongoing relationships with state and federal agencies, associations, and organizations, it continues to collect data that help to develop the most comprehensive profile of Pennsylvania’s 67 counties, especially our 48 rural ones. After all, Pennsylvania is home to our nation’s third largest rural population.
Over the years, the Center has also had the privilege to work with members of the Pennsylvania General Assembly and many organizations, institutions and individuals that are dedicated to addressing both the trials and opportunities that are prevalent in our rural communities. From township supervisors to school librarians, community health centers to community colleges, and legislators to executive branch personnel, the Center is often called upon to share its research and data. This reputation extends beyond Pennsylvania, as the Center is recognized nationally for its quality work and research.
From 1987 to 2017, the end result of the Center’s work has remained constant: to contribute to the body of knowledge about rural Pennsylvania, and to identify program and policy options that can have meaningful impact for rural residents. As the Center commemorates this 30 years of service to the Pennsylvania General Assembly and to rural Pennsylvania, the board and staff thank the Pennsylvania Legislature, and the many institutions, organizations, and individuals that have helped the Center fulfill its mission and contribute to positive change for rural Pennsylvania.
We look forward to continuing that work in the years ahead.
Senator Gene Yaw
State of Addiction Public Hearing
On October 26, the Center sponsored a public hearing, the State of Addiction, at UPMC Susquehanna in Williamsport, Pa., to gather information from federal, state and local officials on the current state of the heroin/opioid crisis in Pennsylvania.
Center Board Chairman Senator Gene Yaw presided over the hearing. He was joined by Board Secretary Dr. Nancy Falvo of Clarion University, Board Member Dr. Michael Driscoll, President of Indiana University of Pennsylvania, Board Member Dr. Timothy Kelsey of Penn State University, and Director Barry Denk.
Presenters included Pennsylvania Attorney General Josh Shapiro, Pennsylvania Acting Secretary of Health and Physician General Dr. Rachel Levine, Pennsylvania Acting Secretary of Drug and Alcohol Programs Jennifer Smith, and Special Agent in Charge Gary Tuggle of the U.S. Drug Enforcement Administration, Philadelphia Field Division.
More information on the hearing is available on the Center's website at www.rural.palegislature.us.
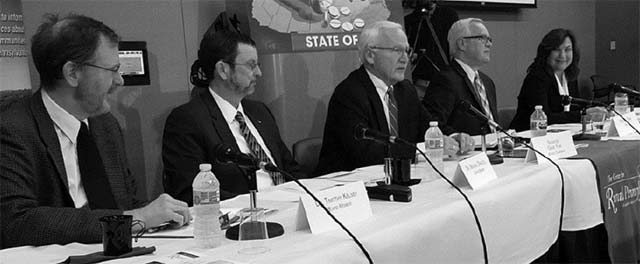
From left: Dr. Timothy Kelsey, Dr. Michael Driscoll, Sen. Gene Yaw, Barry Denk, and Dr. Nancy Falvo.
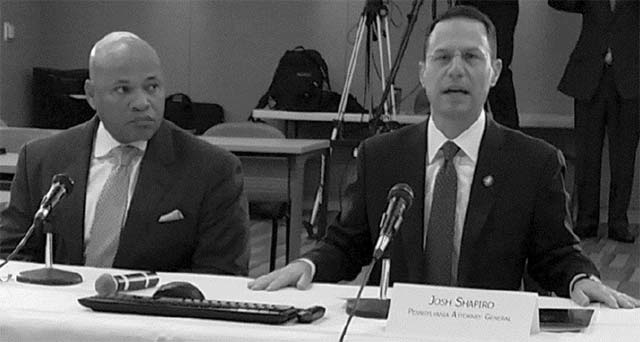
U.S. DEA Special Agent in Charge Gary Tuggle, left, and PA Attorney General Josh Shapiro.
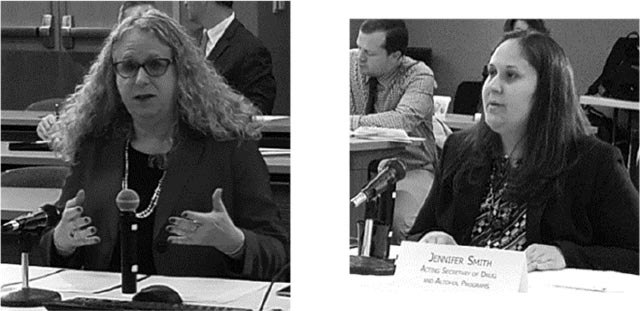
Acting Secretary of Health Dr. Rachel Levine, left, and Acting Secretary of Drug and Alcohol Programs Jennifer Smith.
Rural Snapshot: Health Insurance
Percent of Rural and Urban Pennsylvania Residents Enrolled in Medical Assistance (Medicaid), June 2007 to June 2017
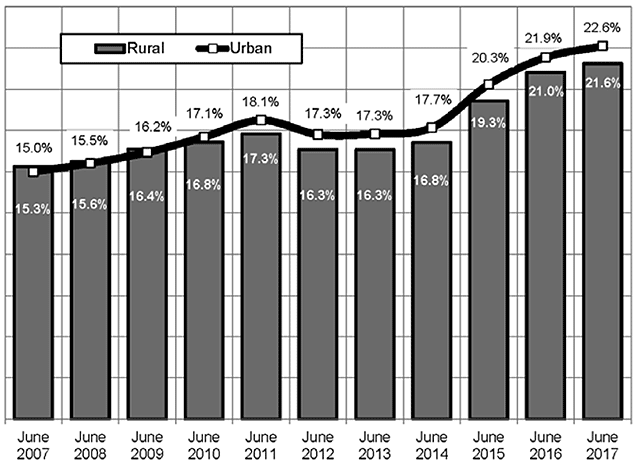
Data source: Pennsylvania Department of Human Services.
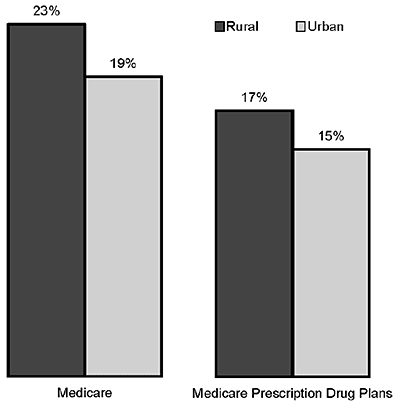
Percent of Rural and Urban Pennsylvanians Enrolled in Medicare and Medicare Prescription Drug Program, 2016
Data source: Centers for Medicare & Medicaid Services.
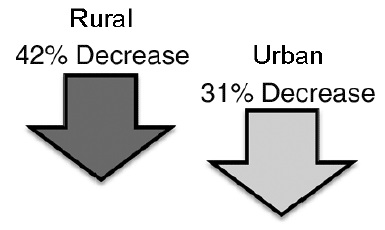
Percent Change in the Number of Uninsured Pennsylvanians Under 65 Years Old, 2005 to 2015
Data source: U.S. Census Bureau Small Area Health Insurance Estimates.
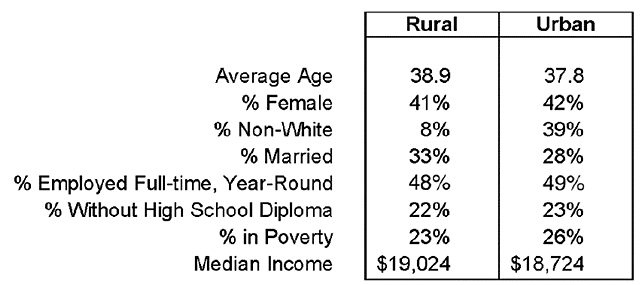
Profile of Rural and Urban Pennsylvania Adults (18+) without Health Care Insurance, 2015
Data source: 2015 American Community Survey, Public Use Microdata Sample, U.S. Census Bureau.
Age of Rural and Urban Pennsylvanians Enrolled in the Affordable Care Act Health Insurance Marketplace, 2017
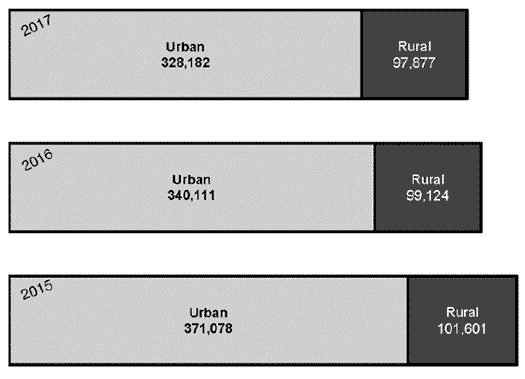
Note: Data excludes enrollees 65 years old and Older. In 2017, these individuals accounted for less than
1 percent of the total rural and urban enrollment.
Data source: 2017 Marketplace Open Enrollment Period Public Use Files, Centers for Medicare and Medicaid Services.
Percent of U.S. Residents Enrolled in Affordable Care Act Health Insurance Marketplace, 2017
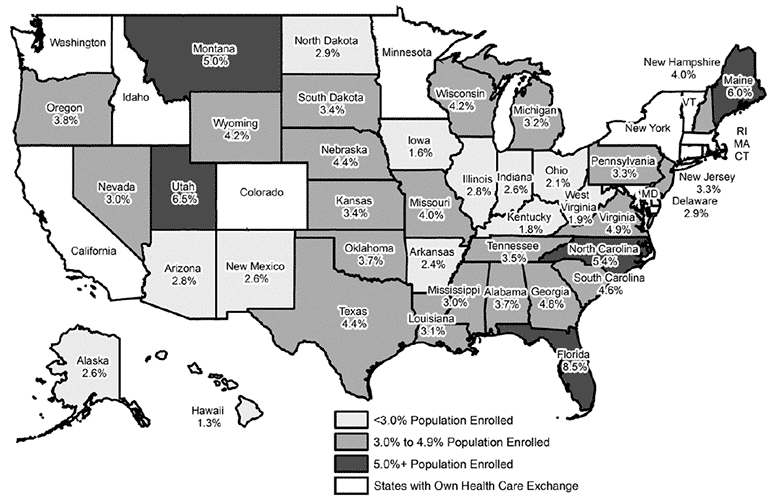
Data source: 2017 Marketplace Open Enrollment Period Public Use Files, Centers for Medicare and Medicaid Services.
Percent of Pennsylvania Residents Enrolled in Affordable Care Act Health Insurance Marketplace, by County, 2017
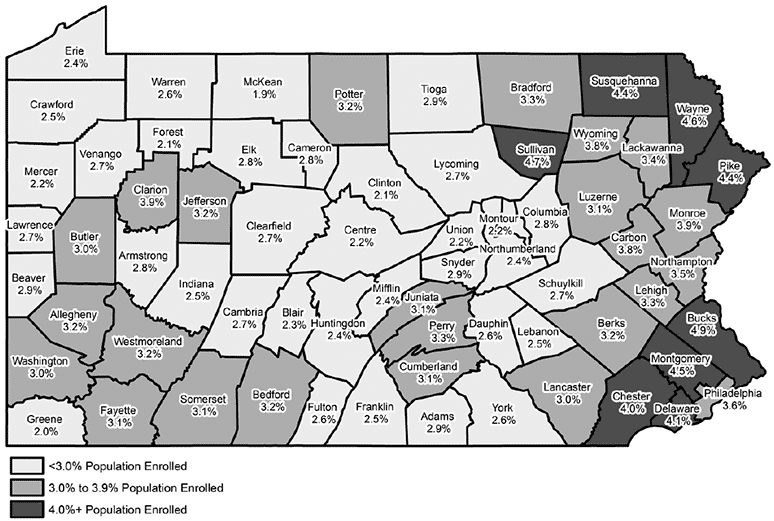
Data source: 2017 Marketplace Open Enrollment Period Public Use Files, Centers for Medicare and Medicaid Services.
Decline in Retail Establishments and Employment
According to data from the Pennsylvania Department of Labor and Industry (L&I), retail isn’t what is used to be. From 2006 to 2016, there was a decline in both retail establishments and retail employment in Pennsylvania.
In 2016, there were 11,368 rural retail establishments that employed approximately 156,900 people. These establishments represented 14 percent of all rural employers and their employees represented 13 percent of the rural workforce. From 2006 to 2016, there was a 9 percent decline in rural retail establishments and a 4 percent decline in rural retail employment.
The largest declines in rural retail establishments were among furniture stores (19 percent), electronics and appliance stores (16 percent), clothing and accessories stores (12 percent), and motor vehicle and parts dealers (12 percent). The two bright spots among rural retailers were general merchandise stores, which include big box retailers and “dollar” stores, and non-store retailers, which include online and catalog stores. General merchandise stores increased 14 percent and non-store retailers increased 3 percent from 2006 to 2016.
In urban areas in 2016, there were 30,173 retail establishments that employed approximately 479,500 people. Urban retailers represented 12 percent of all urban employers and employees represented 11 percent of the urban workforce. From 2006 to 2016, the number of urban retail establishments and employees each declined 3 percent.
The decline in the types of urban retail establishments mirrored rural retail establishments. In urban areas, general merchandise stores increased 23 percent, non-store retailers increased 21 percent, health and personal care establishments, which include drug stores, increased 20 percent, and food and beverage stores increased 3 percent. In rural areas, there was a decline in health and personal care establishments and food and beverage stores (1 percent and 11 percent, respectively).
While the number of rural retailers decreased, average weekly wages for rural retail employees increased. From 2006 to 2016, the average weekly wage for rural retail employees went from $459 to $479, a 4 percent increase. The average weekly wage among urban retail employees decreased 3 percent.
According to the L&I data, there was a significant relationship between the percent change in rural retailers and the change in population, housing units, and employment; there was also a relationship with median household income. The relationship was positive, suggesting that decreases in retail establishments followed decreases in population, housing, and employment. In urban areas, except for the change in employment, there was no significant relationship with these factors and the change in retail establishments.
Data from the U.S. Census Bureau show that the decline in retail establishments is not unique to Pennsylvania. From 2006 to 2015, the number of retail establishments declined in every state except Florida, New York, Nevada, Texas and Utah. Nationwide, there was a 4 percent decline. With a 7 percent overall decline, Pennsylvania ranked 25th in the change in the number of retail establishments.
The change in the number of retail establishments is also reflected in Pennsylvania’s sales tax receipts. In fiscal year 2016, Pennsylvania collected $9.79 billion in sales tax: $3.33 billion, or 34 percent, came from retail establishments. From fiscal year 2007 to fiscal year 2016, the amount of sales tax received from retail establishments declined 5 percent, after adjusting for inflation.
Number of Rural and Urban Pennsylvania Retail Establishments, 2006 and 2016
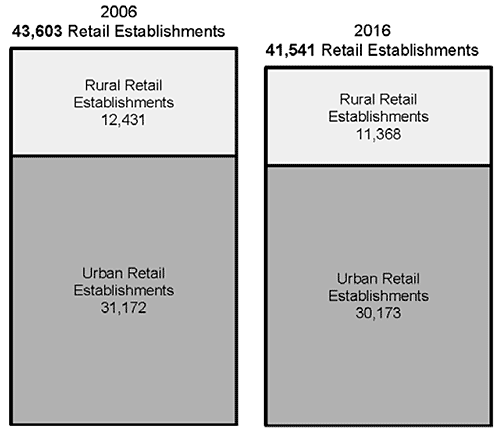
Data source: Pennsylvania Department of Labor and Industry.
Just the Facts: Living on the Road
Data from the Pennsylvania Department of Transportation show there are more than 42,400 miles of state roadways in Pennsylvania. These roadways include state routes, U.S. routes, and interstate highways but do not include municipal roadways. In 2016, 231 million vehicles, on average, used these transportation arteries each and every day. For many rural Pennsylvanians, their homes are located along these roadways.
Using computer mapping, the Center for Rural Pennsylvania estimated that, in 2010, 2.54 million rural residents lived in a Census block that was within 100 feet of a state roadway. These residents account for 73 percent of the total rural population.
A Census block is the smallest level of geography on which the Census Bureau collects data. In 2010, there were more than 421,500 blocks in Pennsylvania, with an average block encompassing one-tenth of a square mile and having 30 residents.
In 2010, an estimated 6.13 million urban residents lived within 100 feet of a state roadway, or 66 percent of the total urban population.
To understand the characteristics of residents whose homes are located along state roadways, the Center aggregated Census blocks to the Census block group level.
In 2010, there were more than 9,700 block groups, each containing 43 Census blocks, on average. The average population of these block groups was 1,300 people and the average size was a little less than 5 square miles. If more than 50 percent of the block group’s population lived in a block along a state roadway, they were considered state roadway block groups.
Rural residents living in block groups along state roadways are generally more affluent than rural residents not living along state roadways. For example, the average home value for those living along state roadways was $158,900, or more than $17,300 higher than rural block groups not along state roadways ($141,600). There was also a similar pattern with household income ($62,200 and $60,500, respectively). Homeownership was 2 percentage points higher for block groups along state roadways (74 percent) than those not along state roadways (72 percent).
Rural block groups along state roadways had a higher percent of people age 65 years old and older than block groups not along state routes (18 percent and 16 percent, respectively); had fewer non-whites (6 percent) than those not along state routes (12 percent); and had fewer households with children (27 percent and 29 percent, respectively).
Another slight difference among these rural block groups was the average commuting time to work. Rural workers living in block groups along state roadways had an average commute time of 27.4 minutes, while workers not living along state roadways had a commute time of 28.1 minutes.
