Newsletters
- Home
- Publications
- Newsletter Archive
- Newsletter
November/December 2016
Inside This Issue:
- Career Guidance Services in Rural and Urban Schools
- Chairman's Message
- Center Holds 11th Public Hearing on Heroin/Opioid Epidemic
- Rural Snapshot: Pennsylvania Public Water Systems
- Bullseye! Pennsylvania's Population Center
- Just the Facts: Reported Cases of Child Abuse.
Career Guidance Services in Rural and Urban Schools
Professional school counselors play important roles in helping students plan for life after high school. Research conducted by faculty from West Chester University of Pennsylvania found that it may be difficult for rural school counselors to implement the same level of service as their urban counterparts since rural schools have fewer counselors, who have less experience and higher caseloads than counselors in urban schools.
In their research, Dr. Cheryl Neale-McFall and Dr. Eric Owens found that counselors in rural schools are spending less time on career guidance and more time on administrative tasks, possibly as a result of having fewer colleagues with whom to share the responsibilities and with whom to collaborate.
The research, A Comparison of Rural and Urban Secondary School Career Guidance Services, was conducted in 2015 and 2016 and sponsored by the Center for Rural Pennsylvania.
Research background
The goals of the research were to examine the services provided by rural and urban secondary school counselors across Pennsylvania. Specifically, the researchers examined historical data on per pupil spending on guidance services across the commonwealth and conducted a survey of secondary professional school counselors to identify the availability of resources, the needs of students and the interventions used to meet those needs, counseling curriculum development, and guidance on STEM-related education and careers.
The researchers used secondary data from the Pennsylvania Department of Education and the U.S. Census Bureau’s American Community Survey (ACS), as well as the survey data from professional school counselors in both urban and rural Pennsylvania districts.
Research findings
Overall, the research found that rural schools had fewer school counselors than urban schools and rural counselors had higher caseloads of students than urban counselors. For example, the average number of counselors per rural school is slightly greater than two and the average in urban schools is about four. The survey indicated that about 63 percent of rural counselors have a caseload of 300 students or more per counselor, which is greater than the American School Counselors Association’s recommendation of 250 students per counselor.
More rural counselors also had fewer years of experience than urban counselors as about 25 percent of rural counselors and about 18 percent of urban counselors had 5 or fewer years of experience.
The research also found that per pupil spending on guidance services was greater in urban districts than rural districts over the 10-year study time period of 2003 to 2013. The average difference in spending was $20.76 per student over the 10 years.
According to the survey results, urban counselors indicated greater use of career interventions, such as career values assessments, college search processes, financial aid planning and military recruiter visits, with students than rural counselors. However, both rural and urban districts were shown to fall short of statewide requirements of a Comprehensive School Counseling Curriculum under Chapter 339 of the Pennsylvania School Code and national recommendations.
In terms of STEM education and career guidance, the research indicated there were significantly more STEM-related classes being offered in urban districts than in rural districts. For example, more than 25 percent of rural counselors were not discussing STEM careers with their students.
Based on these and other study results, the researchers offered several policy considerations for state and local policy makers aimed at positively influencing the career guidance needs of students. For example, the researchers encourage state and local policy makers to increase dedicated funding for career guidance services in rural districts, and school counselors to try to secure external grant funding.
Report available
The research, A Comparison of Rural and Urban Secondary School Guidance Services, is available at www.rural.palegislature.us.
Chairman's Message
It’s hard to believe another year is coming to a close. And as usual, it’s been a busy one at the Center for Rural Pennsylvania.
As you know, the Center works hard to continue building and updating its database, and to share the information it examines and analyzes with you through a variety of platforms, including this newsletter. A good example of the kind of data it mines and analyzes is featured on Pages 4 and 5. This installment of Rural Snapshot takes a look at public water systems and water use, issues that affect us all.
Over the past year, the Center has also published more than half a dozen research reports on a wide variety of issues including domestic violence, Act 13 spending, the economic impact of heritage areas, the financial fitness of volunteer fire companies, the transfer of wealth, and, most recently, school career guidance services, which is featured on Page 1. The Center’s board is currently reviewing submissions to its 2017 Research Grant Program and will announce its decision on the research grant awards in the new year.
This year, the Center also wrapped up its 11th public hearing on the heroin/opioid epidemic. Over the past 3 years, the Center has helped to raise awareness statewide about the crisis and has worked with a whole host of public agencies and private organizations to review all aspects of the crisis €“ from the personal to the professional. I am so pleased that over this past legislative session, the General Assembly has passed several pieces of legislation to address the crisis. And I know it will continue its work to address the issue on all fronts, including education and prevention, treatment, and law enforcement.
As we welcome the New Year, the Center will continue to focus on its mandate of promoting and sustaining the vitality of Pennsylvania’s rural and small communities by informing and educating audiences about the diverse people and communities of rural Pennsylvania and the issues affecting them.
I would be remiss not to acknowledge and thank the Center’s Board of Directors for its work and commitment to the goals and initiatives of the Center. The foresight, knowledge and dedication of each board member have been invaluable to the Center’s work over the years. At the end of the year, Sen. John Wozniak, Dr. Ted Alter, Dr. Karen Whitney and Mr. Taylor Doebler will be leaving the board. On behalf of the board and staff, I thank them for their service to the Center and to rural Pennsylvania.
As the holiday season approaches, I extend my best wishes to you and your families.
Senator Gene Yaw
Center Holds 11th Public Hearing on Heroin/Opioid Epidemic
On September 20, the Center for Rural Pennsylvania held its 11th public hearing on the heroin/opioid epidemic. Sen. Don White hosted the hearing at Indiana University of Pennsylvania.
Testimony presented at the hearing focused on: one family’s struggle to cope with an adult child’s addiction, including health care, child custody, legal issues, and financial strain; a local community’s response to the epidemic; the strain on emergency responders; and how treatment programs are stepping up their response to the epidemic.
More information on the Indiana hearing is available on the Center’s website at www.rural.palegislature.us.
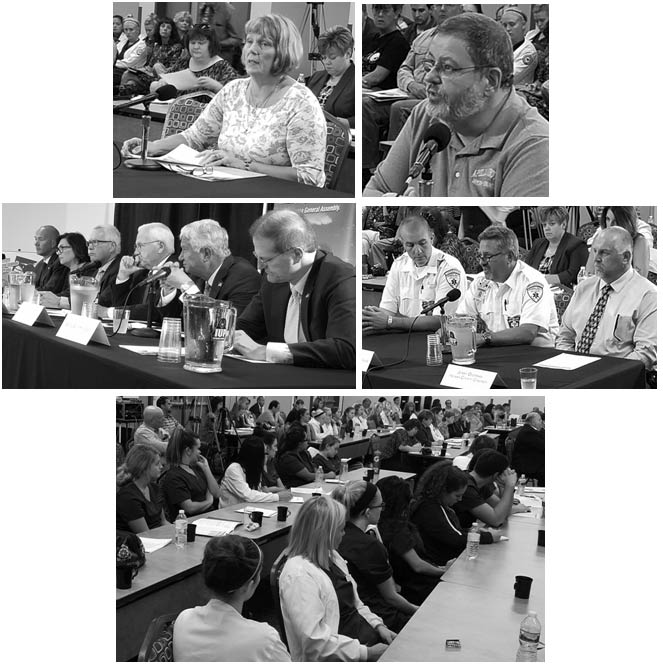
Pictured clockwise from top left: Debbie Friday, parent; Apollo Mayor Jeffrey Held; Indiana Co. Coroner Jerry Overman,
and Randy Thomas and Daniel Christy, Citizen's Ambulance Service; Indiana University nursing students;
and Sen. Patrick Stefano, Dr. Nancy Falvo, Barry Denk, Sen. Gene Yaw, Sen. Don White, and Sen. Scott Hutchinson.
Rural Snapshot: Pennsylvania Public Water Systems
Definition of Public Water Systems
The Pennsylvania Department of Environmental Protection (DEP) defines a public water system (PWS) as a system that provides piped water for human consumption to at least 15 service connections, or serves an average of at least 25 people for at least 60 days each year. Public water systems can be community, nontransient noncommunity, or transient noncommunity systems. Data are from the Pennsylvania Department of Environmental Protection and the U.S. Census Bureau’s 2010 Census unless otherwise noted.
Number of Rural and Urban Public Water System Providers by Type, 2015
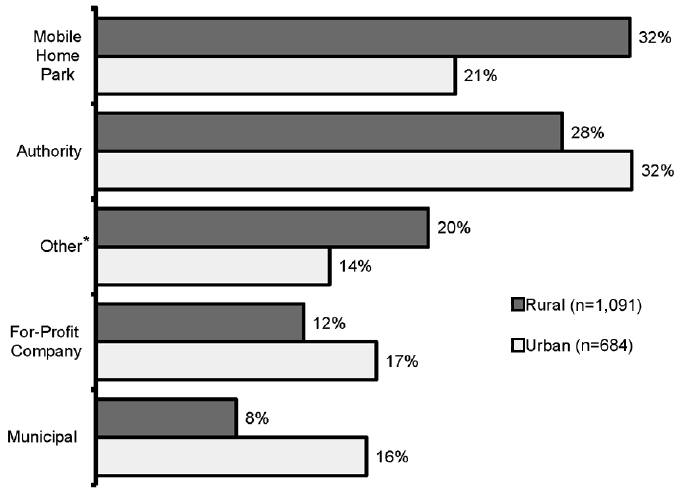
*examples include colleges, nursing homes, hospitals and co-ops.
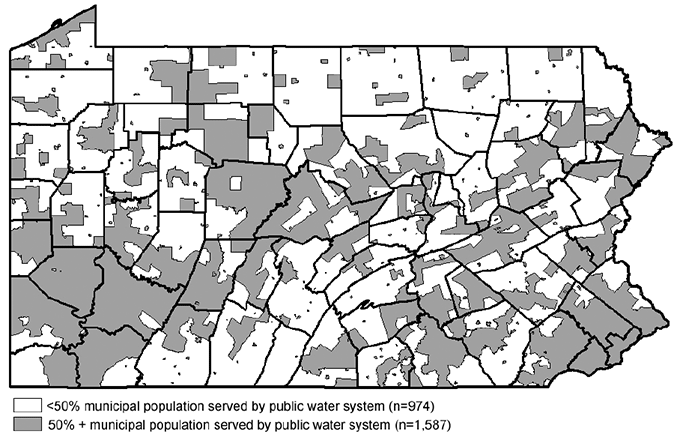
Public Water Systems by Municipality, 2015
Rural and Urban Pennsylvania Water Use, 2010
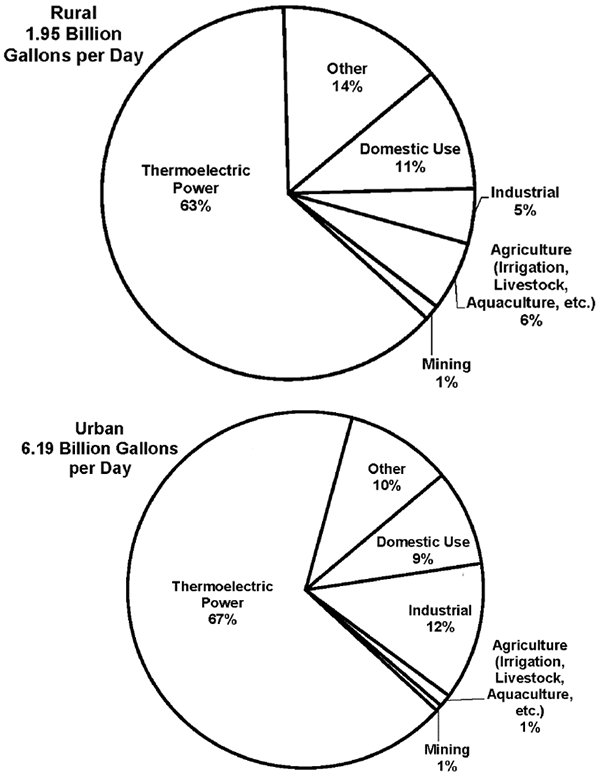
Data source: Water Use in the United States, U.S. Geological Survey
Estimated Rural and Urban Population Within and Outside of Public Water Systems, 2010
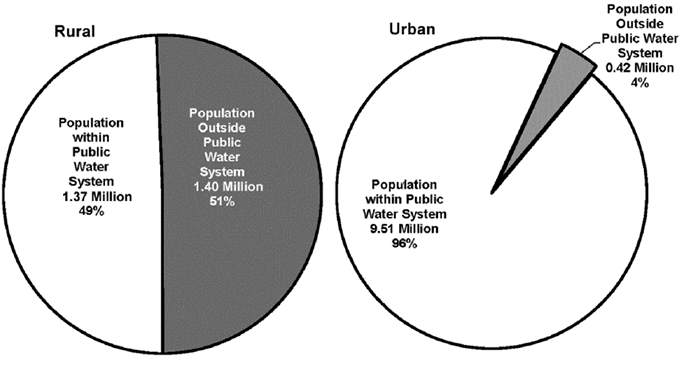
Note: Population is from the 2010 Census. The population was estimated by adding the number of people in Census Blocks that were partially or completely within an area (polygon) served by a public water system. If the population in the Census Blocks was completely outside the area served by a public water system, the Center assumed that it used other methods to access drinking water (wells, springs, etc.). All Census Block data were aggregated to the municipal level.
Rural and Urban Water Withdrawal, Per Capita, 1990 and 2010
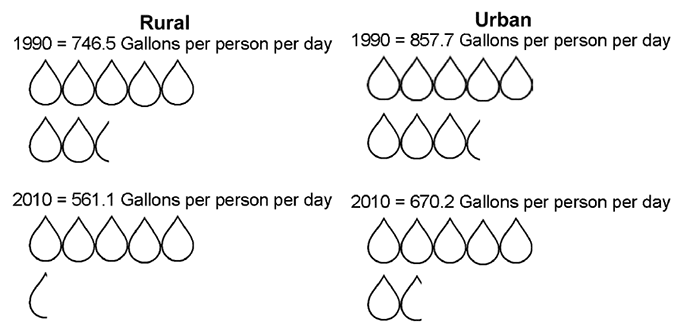
Data source: Water Use in the United States, U.S. Geological Survey.
Bullseye! Pennsylvania's Population Center
Where is the center of Pennsylvania according to its population? To answer that question, let’s imagine that Pennsylvania is a flat map and that an identical weight has been placed at the residence of every person in Pennsylvania. In 2010, that map would balance in a wooded hillside in Watts Township, Perry County.
The U.S. Census Bureau calls this point the “mean center of population.”
As the map below illustrates, during the first five decades of the 20th Century, the population in Pennsylvania flowed from east to west.
However, since 1960, the mean center of population in Pennsylvania has been shifting to the east, about 13 miles overall. This shift is attributed to the population increases in eastern Pennsylvania and population stagnation and decline in western Pennsylvania. From 1960 to 2010, the population in eastern Pennsylvania increased 26 percent and the population in western Pennsylvania declined 9 percent.
In 2010 (the most current data available), the mean center of population in the U.S. was a farm field near Plato, Missouri, a town of about 109 residents.
Mean Center of Pennsylvania's Population, 1900 to 2010
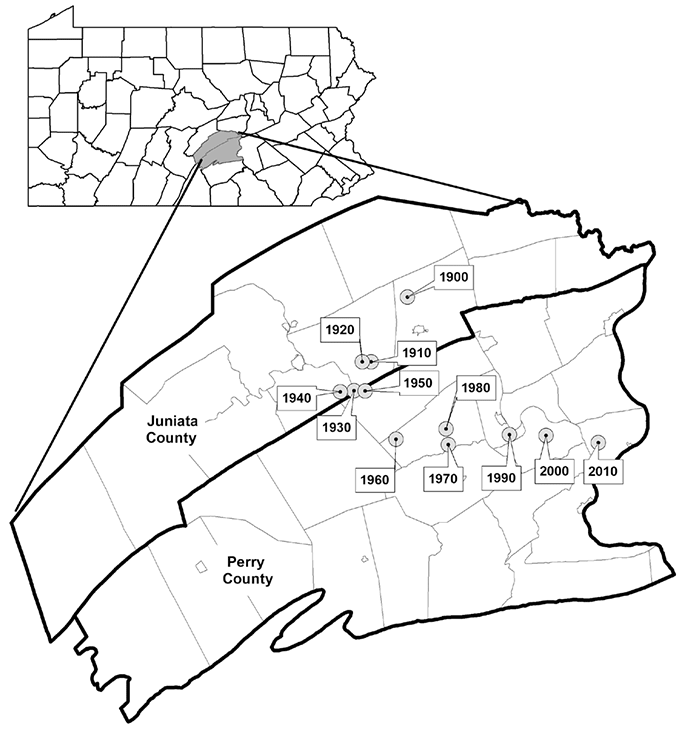
Data source: U.S. Census Bureau.
Just the Facts: Reported Cases of Child Abuse
In 2015, there were 12,614 reported cases of child abuse in Pennsylvania’s 48 rural counties. Of these cases, 1,468, or 12 percent, were “substantiated.” According to the Pennsylvania Department of Human Services, which compiles the data, child abuse is “substantiated” when county children and youth agency or regional staff find that abuse has occurred based on medical evidence, investigation or an admission by the perpetrator. Abuse is also considered substantiated by certain types of court action.
In Pennsylvania’s 19 urban counties, there were 27,976 reported cases of child abuse: 2,735, or 10 percent, of which were substantiated.
Per capita, rural counties had a higher number of substantiated cases (2.2 per 1,000 children) than urban counties (1.4 per 1,000 children).
From 2010 to 2015, the number of substantiated rural cases of child abuse increased 24 percent and the number of substantiated urban cases increased 11 percent. Possible reasons for the increases over this period are changes to the law on those who are mandated to report child abuse and improved state-county coordination of abuse reports.
In 2015, rural counties spent $11.2 million, or $890 per reported incident, to investigate reported child abuse. Urban counties spent $32.3 million, or $1,155 per case, to investigate abuse reports.
According to the most recent data (2014) from the federal Administration on Children, Youth and Families, there were 692,265 cases of substantiated child abuse, or 9.4 cases per 1,000 children. The states with the highest rates were Massachusetts, Kentucky, and Rhode Island, each with more than 16.0 cases per 1,000 children. The states with the lowest rates were Kansas, New Hampshire, and Pennsylvania, each with fewer than 3.0 cases per 1,000 children.
Pennsylvania counties with the highest rates of substantiated cases of child abuse per 1,000 children were Forest, Clarion, and Sullivan. Each had more than 5.0 cases per 1,000 children. Eight of Pennsylvania’s 67 counties had fewer than one substantiated case per 1,000 children. Allegheny, Chester, and Bucks counties had the lowest rates of substantiated cases, each with fewer than 0.5 cases per 1,000 children.
