Newsletters
- Home
- Publications
- Newsletter Archive
- Newsletter
July/August 2018
Inside This Issue:
- Research Compares Rural and Urban Student Drug Use
- Chairman's Message
- Rural Snapshot: Violent Crimes in Pennsylvania
- The Supplemental Nutrition Assistance Program
- DID YOU KNOW . . . Pennsylvania Rail Trails
- Just the Facts: College Enrollment
Analyzing Data from the Pennsylvania Youth Surveys
Research Compares Rural and Urban Student Drug Use
Research to determine if there are differences between urban and rural Pennsylvania youth in substance use, such as alcohol, tobacco, and illicit drugs, and violent behavior found little overall differences between urban and rural students. The only meaningful differences were in alcohol and illicit drug use among rural and urban 12th graders, where urban students showed higher use rates than rural students. Also, for tobacco use, rural students showed higher lifetime use of cigarettes and smokeless tobacco products than urban students.
The research, conducted by Dr. Jennifer Murphy of Pennsylvania State University-Berks, used data from the 2011, 2013, and 2015 Pennsylvania Youth Surveys (PAYS), which are administered by the Pennsylvania Commission on Crime and Delinquency. The research analyzed substance use rates and instances of violent threats and behavior among 6th, 8th, 10th and 12th grade students over time in urban and rural Pennsylvania.
The research also analyzed various risk and protective factors associated with rural substance use and violence, and the impact of school-based intervention/prevention programs on rates of substance use and violence for rural youth.
In terms of alcohol and illicit drug use, the results indicated little overall differences between urban and rural Pennsylvania students. The only meaningful difference was among rural and urban 12th graders in rates of lifetime and past 30 day marijuana use, where urban students showed higher use rates than rural students. For example, about 42 percent of urban 12th grade students reported lifetime marijuana use, compared to about 35 percent of rural students. In addition, 24 percent of urban students in the 12th grade reported using marijuana in the past 30 days compared to about 16 percent of rural students in the 12th grade.
Rural students showed higher lifetime use of cigarettes and smokeless tobacco products than their urban counterparts. The urban/rural difference for lifetime cigarette use emerged at the 8th grade level, as rural youth had 5 percent higher use than urban students, indicating that rural youth appear to start experimenting with cigarettes at a younger age. Urban students reported higher disapproval rates of smoking among their peers, which indicates that rural youth may view the use of tobacco products as more acceptable than urban youth. Since a large proportion of rural students are using tobacco products, the research indicates the need for programming at early grades to discourage smoking and the use of other tobacco products.
Interestingly, electronic vapor products appear to be popular among both rural and urban students, since both groups are using these products at a high rate: about 27 percent of rural 10th and 12th grade students and 24 percent of urban 10th and 12th grade students reported using an electronic vapor product in the past 30 days. The substantial use of electronic vapor products should be of major concern.
These products may be viewed as safer than cigarettes, so more students may be willing to try them. However, these products are still addictive substances and there is a need for anti-vaping programming to occur in early grade levels.
In terms of violent behavior, victimization, and being threatened with violence, the research found no overall differences between urban and rural students.
Rural and urban students also did not demonstrate meaningful differences on risk scores for various family, school, and peer-related characteristics.
Analysis of how these characteristics impact rural student substance use and violence showed that previously established risk factors related to family life, school performance, and peer relations that have been associated with drug use and delinquency also impact on rural youth. Students who were at risk in these areas showed higher levels of substance use and violent behavior/victimization at school.
Peer-related factors were the strongest predictors of substance use and violent behavior.
Finally, prevention services in rural schools did not appear to be related to changes in substance use and violence rates in schools.
However, the research only examined the number of prevention programs in a school district and the data did not include details about individual programs operating in schools. Further research could examine the rural schools that had the biggest reductions in substance use between 2013 and 2015 and attempt to get more school-specific details about the programs that operated in those schools.
Click here for a copy of the research report, Comparing Rural and Urban Drug Use and Violence in the Pennsylvania Youth Survey.
Lifetime Alcohol and Drug Use by Urban/Rural School, All Grades
(number of students in parentheses)
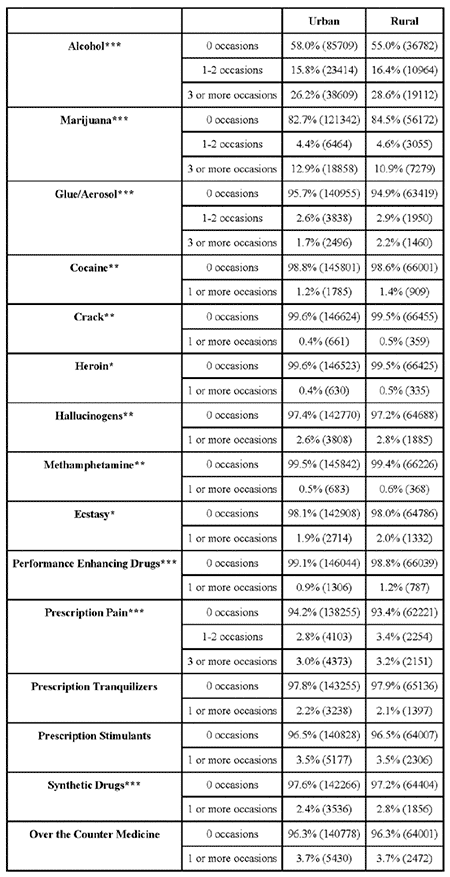
Variables are flagged as significant at the .05 level (*), the .01 level (**), and the .001 level (***); however, it should not be concluded that a statistically significant difference is a meaningful difference between groups. It just means that a difference would be expected in the population, however small. Source: 2015 Pennsylvania Youth Survey (PAYS).
Chairman's Message
Every two years, the Pennsylvania Commission on Crime and Delinquency surveys school students through its Pennsylvania Youth Survey, or PAYS. The survey is administered to 6th, 8th, 10th and 12th grade students to understand their views on their school environment, their attitudes, knowledge and use of alcohol, tobacco, and other drugs, and their experience with violence, depression, and other problem behaviors. The surveys help schools and state agencies assess patterns and changes in the use and abuse of these harmful substances and behaviors. It also helps to assess risk factors that are related to these behaviors and the protective factors that may help students to avoid them.
Because of its ongoing interest and work on the heroin/opioid addiction epidemic, the Center’s Board of Directors wanted to know if there were meaningful differences between urban and rural youth in terms of drug and alcohol use and other behaviors. It sponsored research in 2017 to review the PAYS data, and as indicated in the article on Page 1, the research found meaningful differences between rural and urban youth in the use of tobacco and marijuana.
In terms of heroin, the research found that .4 percent of urban students and .5 percent of rural students had used heroin on one or more occasions over their lifetime, and that about 3 percent of both urban and rural youth had used prescription pain medication more than three times over their lifetime. While these percentages are low, they indicate that some urban and rural youth are at high risk. And what’s just as troubling, the research found that 26 percent of both urban and rural students thought it would be very or somewhat easy to obtain prescription drugs. We don’t know if that means accessing prescription drugs on the street, or in the family medicine cabinet, but we do know one quarter of the students surveyed think they can access these drugs easily.
That tells me early education and prevention programs are, and will continue to be, extremely important. We need to continue supporting programs in our schools and our communities, like evidence-based student assistance programs and community-based task forces and coalitions. Expanding the availability of drug take-back boxes, in secure, readily accessible locations, is one easy way to get unused medications out of the home and out of harm’s way. Having naloxone readily available and people trained in its administration might be the prevention effort needed most when someone has overdosed and seconds count.
The Center for Rural Pennsylvania will continue to sponsor research and be involved in efforts that help inform and educate Pennsylvania government and our citizens about substance use disorders and this disease of addiction. Stay tuned.
Senator Gene Yaw
Rural Snapshot: Violent Crimes in Pennsylvania
Definition of Violent Crimes and Data Source
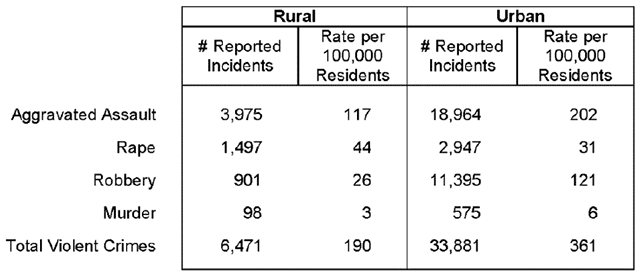
According to the Pennsylvania State Police, violent crimes include aggravated assault, rape, robbery, and murder. All data for this snapshot are from the Pennsylvania State Police Annual Uniform Crime Reports.
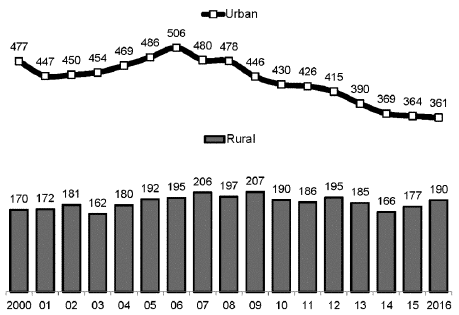
Violent Crime Rate in Rural and Urban Pennsylvania, 2000 to 2016
(Number of reported incidents per 100,000 residents)
Reported Crimes in Rural and Urban Pennsylvania, 2016
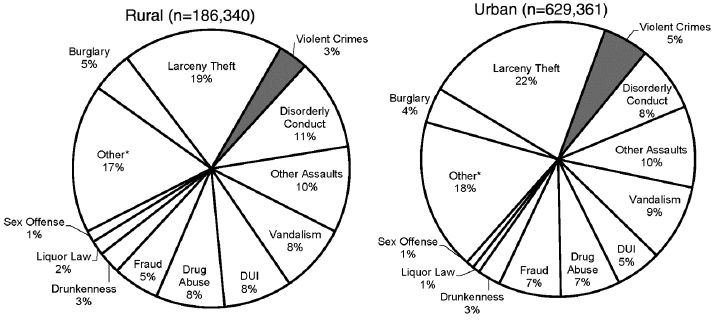
*€œOther€ includes the following reported offenses: forgery, weapon, family offense, vagrancy, stolen property, embezzlement, prostitution, gambling, negligent manslaughter, motor vehicle theft, arson and other.
Number of Reported Violent Crimes, 2016
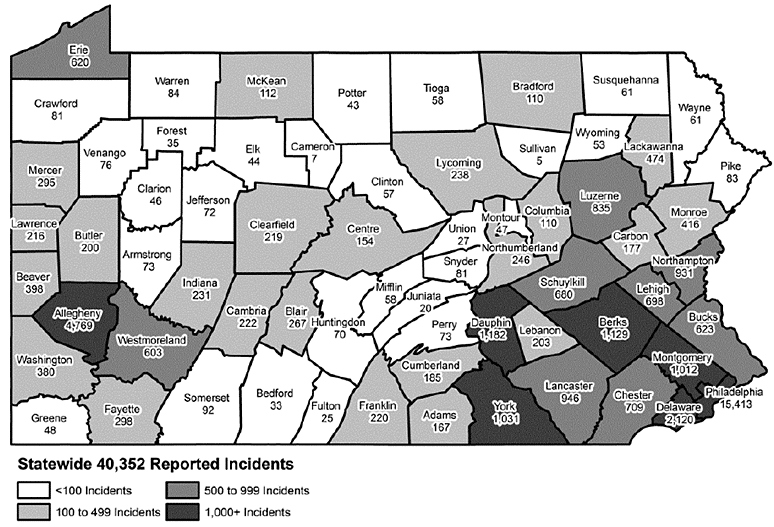
Types of Violent Crimes in Rural and Urban Pennsylvania, 2016
Rural and Urban Violent Crime Clearance Rates, 2012-2016
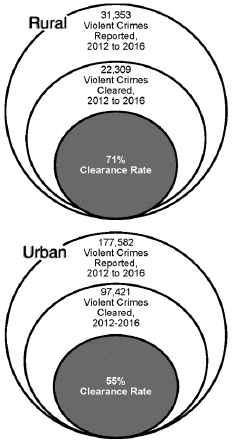
An offense is considered to be €œcleared€ when at least one person involved in the crime has been arrested, charged, and turned over to the court for prosecution. An offense can also be cleared by exceptional means, such as when an element beyond law enforcement's control prevents the filing of formal charges against the offender.
Number of Full-time Police Officers per 1,000 Residents, 2000, 2010, and 2016

The Supplemental Nutrition Assistance Program
SNAP, the Supplemental Nutrition Assistance Program, is a federally funded program that provides food assistance to people over age 60, people with disabilities and low-income households. July 2017 data from the Pennsylvania Department of Human Services showed that 462,816 rural residents, or 14 percent of the rural population, received SNAP benefits, with an average monthly benefit per recipient of $112. Among the 1.38 million urban residents, or 15 percent of the urban population, receiving SNAP benefits, the average monthly benefit was $125.
From June 2013 to July 2017, the number of rural and urban residents receiving SNAP benefits increased 2 percent each.
According to the U.S. Department of Agriculture, there are more than 10,200 authorized SNAP retailers in Pennsylvania. Twenty-seven percent of these retailers are in rural areas and 73 percent are in urban areas.
For a look at the characteristics of households receiving SNAP benefits, the Center for Rural Pennsylvania analyzed the 2016, American Community Survey, Public Use Microdata Sample (ACS-PUMS). Here are the results:
- Rural households had 2.6 persons, on average, living in the household, and urban households had 2.8 persons, on average.
- 41 percent of rural and 46 percent of urban households had children (persons under 18 years old) living in the household.
- 24 percent of rural households were married couples, 22 percent were unmarried parents with children, 34 percent lived alone, and 20 percent were other types of households. Among urban households, 20 percent were married couples, 27 percent were unmarried parents with children, 29 percent lived alone, and 24 percent were other types of households.
- 46 percent of rural households and 44 percent of urban households had incomes below the poverty level.
- $19,648 was the median rural household income; $20,555 was the median urban household income.
- 31 percent of rural households had one or more people employed full-time, year-around, and 69 percent had no household members employed full-time, year-around. For urban households, 36 percent had one or more people employed full-time, year-around, and 64 percent had no household members employed full-time, year-around.
- 60 percent of rural and 69 percent of urban householders were renters. The median monthly rent for rural households was $650 and for urban households was $793.
- 47 percent of rural and 49 percent or urban householders lived in the same home for less than 5 years.
- 22 percent of rural households and 35 percent of urban households did not have a vehicle.
- On average, rural householders were 50.1 years old and urban householders were 49.1 years old.
- 93 percent of rural and 54 percent of urban householders were white.
- 63 percent of rural householders were female and 37 percent were male. 67 percent of urban householders were female and 33 percent were male.
- 66 percent of rural households had a high school diploma or less. 61 percent of urban householders had a high school diploma or less.
DID YOU KNOW . . . Pennsylvania Rail Trails

133 Number of rail trails in Pennsylvania.
1,662 Number of miles of rail trails in Pennsylvania.
2 Number of Pennsylvania rail trails that are more than 140 miles long.
They are the Great Allegheny Passage and D&L Trail.
8.45 Million Number of Pennsylvanians living within five miles of a rail trail.
300 Estimated number of bicycle shops, and bike tour operators in Pennsylvania.
73 Estimated number of bike shops/bike tour operators located in rural Pennsylvania.
Data sources: Pennsylvania Department of Conservation and Natural Resources, 2018, and Infogroup, Reference USAGov.
Just the Facts: College Enrollment
There are 57 colleges and universities located in rural Pennsylvania, according to data from the U.S. Department of Education. In the fall of 2016, more than 173,100 students, or 5 percent of the rural population, attended these institutions.
In urban Pennsylvania, there are 206 colleges, and approximately 565,700 students, or 6 percent of the urban population, attended these institutions in the fall of 2016.
From 2012 to 2016, enrollment in rural and urban Pennsylvania colleges declined 5 percent and 4 percent, respectively.
Statewide, the change in college enrollment varied by type of institution. For example, publicly funded colleges, like the 14 state system universities and community colleges, had a 5 percent decline in enrollment from 2012 to 2016. For-profit colleges had a 41 percent decline from 2012 to 2016. Non-profit colleges had a slight increase in enrollment of 1 percent; this however, was limited to 52 colleges as the majority (71) had a decline or no change in enrollment.
There are likely many causes for the decline in rural and urban college enrollment. Two contributing factors might be a decrease in the number of high school graduates and a decrease in the number of graduating seniors planning to attend a postsecondary institution.
According to data from the Pennsylvania Department of Education, from the 2011-12 school year to the 2015-16 school year, the number of rural high school graduates declined 7 percent and the number of urban graduates declined 6 percent. During this same period, the percentage of rural high school graduates planning to attend postsecondary institutions went from 67 percent of all graduates to 65 percent of all graduates. Among urban graduates, the rate dropped 5 percentage points (74 percent to 69 percent).
Pennsylvania is not unique in declining college enrollment. From 2012 to 2016, 39 other states had a decrease in enrollment. The states with the largest decreases were Hawaii, New Mexico, and Wyoming, each with a decrease of more than 10 percent. Among the 11 states with enrollment increases, the top three were Delaware, Arizona, and New Hampshire, each with an increase of more than 30 percent.
The decline in Pennsylvania college enrollment could be seen as a return to the historic average. From 1990 to 2012, the total average enrollment in Pennsylvania colleges was approximately 651,100. The fall 2016 total enrollment was 738,800, or 13 percent above the historic average.
