Newsletters
- Home
- Publications
- Newsletter Archive
- Newsletter
July/August 2017
Inside This Issue:
- 10 Year Outlook on Rural Pennsylvania's Economy
- Chairman's Message
- Pennsylvania's Heroin/Opioid Crisis: Resident Attitudes and the Role of State Government
- Rural Snapshot: School Safety Indicators
- Pennsylvania State Police Coverage in Pennsylvania Municipalities
- Just the Facts: Social Security Dependent Households
10 Year Outlook on Rural Pennsylvania's Economy
The healthcare and social assistance industry is projected to be the fastest growing industry in Pennsylvania from 2012 to 2022, according to research conducted by faculty at East Stroudsburg University of Pennsylvania and sponsored by the Center for Rural Pennsylvania. It’s not surprising that this industry is projected to be the fastest growing, since Pennsylvania, and especially rural Pennsylvania, has one of the highest senior citizen populations in the country.
The research, Economic Outlook for Rural Pennsylvania Over the Next 10 Years, indicated that employment in this sector is projected to grow three times as fast as the average growth of total employment for both the U.S. and Pennsylvania.
The research indicated that employment in Pennsylvania’s healthcare and social assistance industry is projected to increase by 175,880 new jobs. Other industries with large projected increases in employment over the study period are professional and technical services (52,290 jobs), administrative and waste services (48,670 jobs), construction (43,110 jobs), and accommodation and food services (33,630 jobs).
Researchers Todd Behr, Dr. Constantinos Christofides, and Dr. Pattabiraman Neelakantan, of East Stroudsburg University, conducted the study in 2015 and 2016 using projections from the U.S. Bureau of Labor Statistics and the Pennsylvania Department of Labor and Industry’s Center for Workforce Information and Analysis. The research ranked industries according to the greatest growth in jobs and percentage growth in jobs over the decade (2012-2022) for the nation, the state, and the state’s 22 Workforce Investment Areas.
According to the research, there are some differences in the growth industries in rural and urban Pennsylvania. For example, healthcare, construction, and accommodation and food services are projected to grow rapidly in both rural and urban counties. However, administrative and waste services are projected to grow in urban counties but not rural counties since the markets for those services are in densely populated areas. Employment in transportation and warehousing is projected to grow faster in rural but not urban areas because the industry requires more spacious environments for truck traffic and the construction of warehouses.
The growth of certain industries requires the growth of certain occupations so it’s not surprising that the fastest growing occupations at the national, state, and rural and urban levels are all associated with the healthcare industry, including healthcare practitioners, healthcare support, and personal care and service occupations.
Business and financial operations and computer and mathematical occupations are expected to grow faster in urban Pennsylvania, and transportation and material moving occupations are projected to grow faster in rural counties.
Food preparation and serving-related occupations are projected to grow significantly statewide as the leisure and hospitality industry grows.
Click here for a copy of the report, Economic Outlook for Rural Pennsylvania Over the Next 10 Years.
Chairman's Message
I am always fascinated with the data the Center for Rural Pennsylvania maintains on our 67 counties and state as a whole. Here is one bit of information that may surprise some: Pennsylvania has the fifth largest population of people age 65 years old and older in the nation. Not surprisingly, many of our older residents tend to require the services of the healthcare industry.
In a recent study sponsored by the Center, the researchers estimated that the healthcare and social assistance industry is expected to experience the largest gains in employment in the coming years. That research, which is featured on Page 1, estimated that jobs in the healthcare industry will increase by more than 175,000 in Pennsylvania over the next 10 years.
The research also estimated large projected increases in employment in the professional and technical services, administrative and waste services, construction, and accommodation and food services industries.
The research indicated that occupations in support of the healthcare industry, such as healthcare practitioners, healthcare support, and personal care and service, will probably grow as well.
For most individuals who want to work in any of these occupations, higher education opportunities are important. I think we’re fortunate in Pennsylvania to have a large number of colleges, universities and other higher education institutions, including our community education councils and community colleges, which can provide the education and training for those who want to work in healthcare.
If you’ve been following the news on the heroin/opioid epidemic that is affecting Pennsylvania and the nation, we have more information to share about public opinion on the crisis on Page 3. The Center included two questions on the heroin/opioid epidemic in the most recent Penn State Poll to find out resident attitudes on the main causes of the crisis and state government’s role in addressing it.
While the respondents did not zero in on one main cause of the epidemic, they did indicate that state government has a role in addressing the crisis.
I know that state government, including the Center for Rural Pennsylvania, has been very active in raising awareness of this epidemic. The General Assembly has also been working on a variety of legislation to address various aspects of the crisis, including prevention and education, law enforcement, and treatment. This epidemic did not happen overnight, and it is not going to be fixed anytime soon. However, I’m confident that Pennsylvania will continue to take positive steps forward in addressing all aspects of this crisis.
Senator Gene Yaw
Pennsylvania's Heroin/Opioid Crisis: Resident Attitudes and the Role of State Government
Pennsylvania residents believe that individuals making bad personal decisions and the overprescribing of addictive medications are the main causes of Pennsylvania’s heroin/opioid crisis. That's according to results from the Spring 2017 Penn State Poll conducted by the Center for Survey Research at Penn State-Harrisburg.
The Center for Rural Pennsylvania contracted with the center to include two questions in its Spring 2017 poll. The questions in the poll asked adult respondents (age 18 and older) to identify the main causes of the heroin/opioid crisis and the role of state government in addressing it.
A total of 609 respondents completed the survey and the margin of error is plus or minus 4.0 percentage points.
The results
According to the polls results, 36 percent of respondents said individuals making bad personal decisions and 31 percent of respondents said the overprescribing of addictive medication were causes of the crisis.
In terms of state government’s role in addressing the crisis, 99 percent of respondents agreed that state government has a role in addressing the epidemic. The role that state government should play, however, was not as clear cut. Thirty-seven percent of respondents said the focus of state government should be stricter law enforcement for those selling or dealing drugs, 30 percent said it should be funding appropriate treatment and counseling services, and 26 percent said providing age-appropriate education and prevention programs. The remaining 7 percent of responses varied.
Among respondents who said that the heroin/opioid crisis was a priority for state government, 49 percent of rural respondents said stricter law enforcement should be the main focus. Among urban respondents, 32 percent said stricter law enforcement and another 32 percent said funding for treatment and counseling services should be the main focus.
There were different views on what the focus of state government should be according to race/ethnicity. More nonwhite and/or Hispanic respondents (42 percent) than white, non-Hispanic respondents (about 23 percent) said education and prevention programs should be the focus. More white, non-Hispanic respondents (40 percent) than nonwhite and/or Hispanic respondents (23 percent) said stricter law enforcement should be the focus.
Income seemed to be a significant factor in respondents’ opinions as 43 percent of respondents with household incomes under $100,000 supported stricter law enforcement while 39 percent of respondents with household incomes of $100,000 and more supported treatment and counseling programs.
Responses also varied according to the respondents’ educational attainment: 51 percent of respondents with a high school diploma or less said stricter law enforcement should be the focus while 30 percent of respondents with a bachelor’s degree or higher said the same.
The bottom line
While there was no consensus on the cause of the heroin/opioid crisis, there was solid agreement that state government has a role in addressing it.
Click here for a copy of the fact sheet, Pennsylvania’s Heroin/Opioid Crisis: Resident Attitudes and the Role of State Government.
Rural Snapshot: School Safety Indicators
A Note on the Safe Schools Act
The Safe Schools Act of 1995 (Act 26) established the Office for Safe Schools in the Pennsylvania Department of Education (PDE) and authorized PDE “to coordinate anti-violence efforts between school, professional, parental, governmental, law enforcement and community organizations and associations.”
The act also requires PDE to provide school entities with information, direct training, technical assistance tools and forms needed to enhance local school safety efforts.
Act 26 was amended in 1997 (Act 30) to mandate annual reporting of all incidents of violence, weapons, alcohol, drugs and tobacco possession to PDE. Another amendment to Act 26 (Act 104 of 2010) clarifies the requirements around reporting school violence incidents, mandates the creation of a statewide school safety advisory committee and establishes requirements for dating violence prevention policies and programs.
Source: Center for Schools and Communities’ Center for Safe Schools.
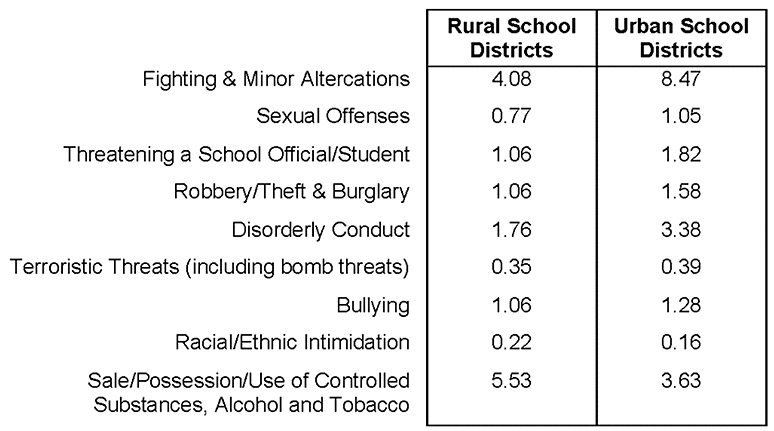
School Safety Indicator Rates, 2015-16
(Number of reported incidents per 1,000 students)
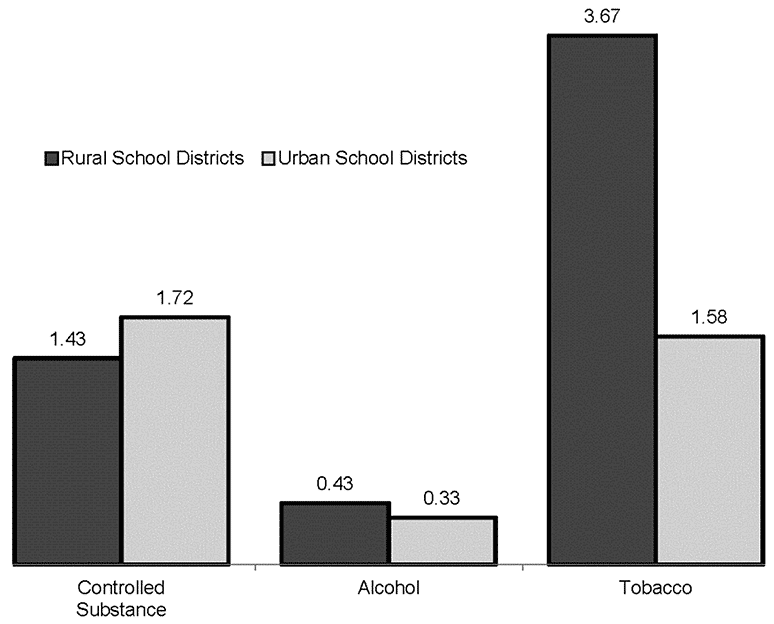
Rate of Sale, Possession, or Use of Controlled Substances, Alcohol or Tobacco by Rural and Urban School Districts, 2015-16
(Number of Reported Incidents of Students Selling, Possessing, or Using Controlled Substances, Alcohol or Tobacco per 1,000 Students)
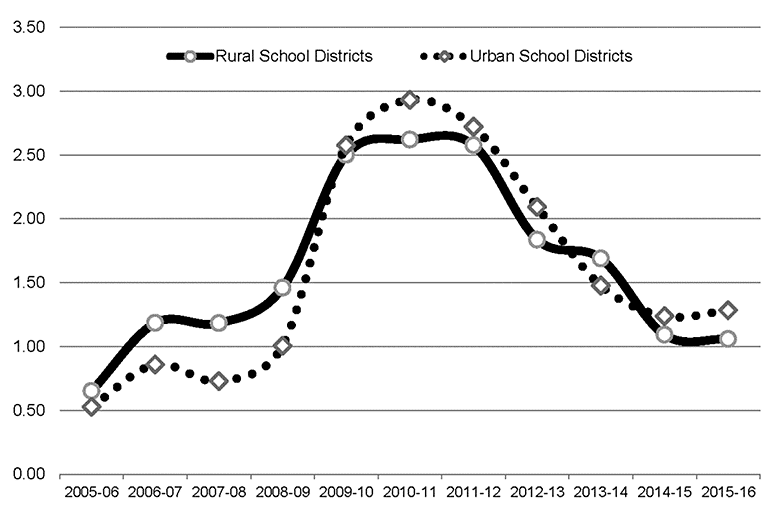
Bullying Rates by Rural and Urban School Districts, 2005-06 to 2015-16
(Number of Reported Incidents of Bullying per 1,000 Students)
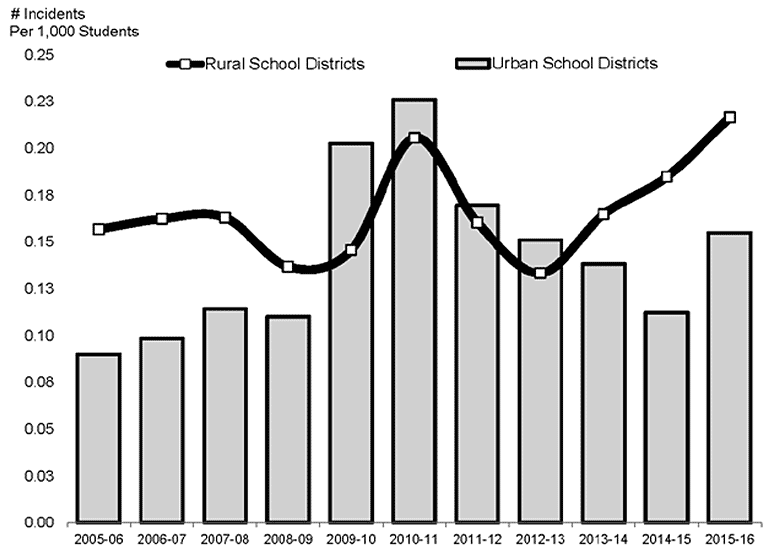
Racial/Ethnic Intimidation Rates by Rural and Urban School Districts, 2005-06 to 2015-16
(Number of Reported Incidents of Racial and Ethnic Intimidation per 1,000 Students)
Number of School Safety Incidents Involving Local Law Enforcement per 1,000 Students, by School District, 2015-16
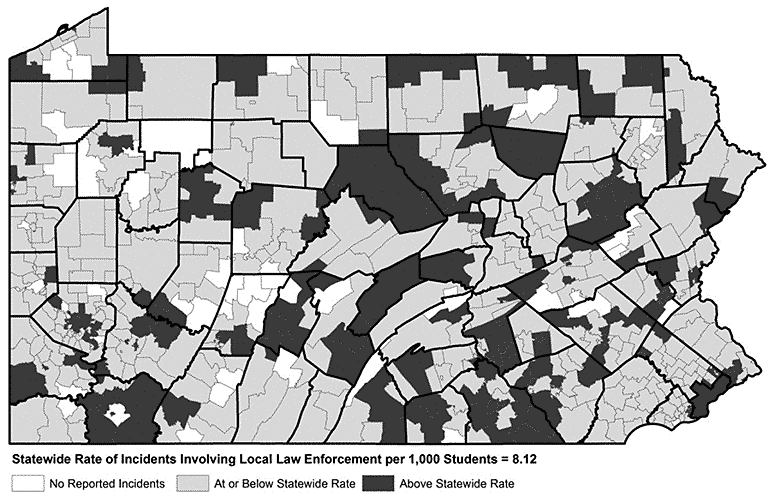
In 2015-16:
- The truancy rate in rural school districts was 7 percent and in urban school districts was 11 percent.
- 292 students in rural school districts were expelled and 994 students in urban school districts were expelled.
- 782 rural school students and 2,662 urban school students were arrested.
- 348 rural and 1,519 urban school students were assigned to alternative education.
Note: The data exclude the Bryn Athyn School District. Data source: Pennsylvania Department of Education.
Pennsylvania State Police Coverage in Pennsylvania Municipalities
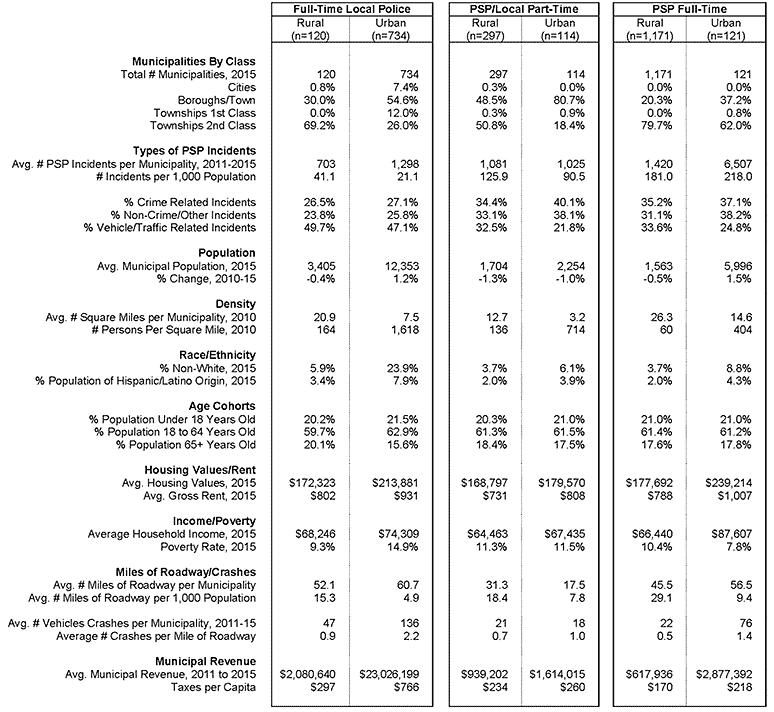
In June, the Center for Rural Pennsylvania released an analysis of Pennsylvania State Police coverage in rural and urban municipalities.
The Center worked with the Pennsylvania State Data Center to review Pennsylvania State Police (PSP) data on the number of incidents to which the PSP responded over the 5-year period of 2011 to 2015.
According to the analysis:
- More rural municipalities rely on the PSP for full-time or part-time police services than urban municipalities.
- The majority of PSP incidents occurred in municipalities that rely on the PSP for coverage.
- The types of incidents to which the PSP respond vary by the type of police coverage in municipalities.
- Municipalities with a high number of incidents to which the PSP respond have larger populations, revenues, and vehicle crashes than municipalities with a medium or low number of incidents.
Click here for a copy of the fact sheet, Pennsylvania State Police Coverage in Rural and Urban Pennsylvania Municipalities.
Rural and Urban Municipalities by Type of Police Coverage
Just the Facts: Social Security Dependent Households
In 2015, U.S. Census data indicated that about 39 percent of rural households received income from Social Security. The median income these households received from Social Security was $16,821, or 45 percent of their total household income of $37,948.
For some rural and urban households, however, Social Security was the main source of income. Specifically, these were households in which 90 percent or more of their income came from Social Security. We’ll call these households, “Social Security dependent.”
In 2015, it was estimated that approximately 128,000 rural households, or 8 percent of all rural households, were Social Security dependent. Among urban households, approximately 200,400, or 6 percent of all urban households, were Social Security dependent.
Among rural Social Security dependent households, total median income was $15,790, from which 99 percent came from Social Security. Among urban dependent households, total median income was slightly lower, at approximately $15,320, 98 percent of which came from Social Security.
In 2015, 28 percent of rural and 32 percent of urban Social Security dependent households were in poverty. The poverty threshold in 2015 for a single person was $12,082.
Rural Social Security dependent households had 1.5 residents, and were 69.4 years old, on average. Urban dependent households were similar.
There were, however, some differences between rural and urban Social Security dependent households. For example, 46 percent of rural and 33 percent of urban residents in Social Security dependent households were married and 16 percent of rural and 14 percent of urban residents in these households were military veterans.
In addition, 6 percent of rural and 13 percent of urban residents in Social Security dependent households had a bachelor’s degree or higher. Homeownership was higher among rural Social Security dependent households than urban Social Security dependent households (64 percent and 56 percent, respectively).
Across the U.S., there were an estimated 7.05 million Social Security dependent households, or 6 percent of all households. The states with the highest percentages of these households were Mississippi, West Virginia, and Arkansas, each with more than 8 percent. The states with the lowest percentages of these households were Utah, Maryland, and Alaska, each with less than 4 percent. Among all states, Pennsylvania had the 17th highest percentage of Social Security dependent households, with 7 percent.
