Newsletters
- Home
- Publications
- Newsletter Archive
- Newsletter
May/June 2019
Inside This Issue:
- Research Documents Slower Broadband Speeds in Rural Pennsylvania
- Youth Overweight/Obesity Rates Remain Steady
- Chairman's Message
- Rural Snapshot: 2017 Census of Ag Results
- 2020 Census: What's in it for me?
- Spotted Lanternfly Quarantine Expanded
- Just the Facts: Female and Male Small Town Municipal Officials
Buffering, buffering, buffering . . .
Research Documents Slower Broadband Speeds in Rural Pennsylvania
Results from a year-long research project measuring median broadband speeds across Pennsylvania indicate that Federal Communications Commission (FCC) estimates of broadband speeds are not showing the true state of the digital divide in Pennsylvania. According to the FCC’s official broadband maps from December 2017 (updated in May 2019), broadband speeds that exceed 25 megabits per second are 100 percent available across the entire state. However, this new research indicates that there isn’t a single Pennsylvania county where at least 50 percent of the population have broadband connectivity, defined by the FCC as 25 megabits download speed and 3 megabits upload speed.
The results also indicate that connectivity speeds are substantially slower in rural counties than in urban counties.
“Many of us, with just one touch of a finger or click of a mouse, can quickly connect to the world around us,” said Sen. Gene Yaw, chairman of the Center for Rural Pennsylvania’s Board of Directors. “But as this research points out, that’s not always the case for many rural Pennsylvanians.”
The research, Broadband Availability and Access in Rural Pennsylvania, was conducted by Penn State University’s Palmer Chair in Telecommunications Sascha Meinrath and a team of researchers who developed a replicable research methodology that used open source tools for collecting broadband data. Both the tools and the data are publicly available.
Throughout the course of the research, which was sponsored by the Center for Rural Pennsylvania and conducted in 2018, the research team collected more than 11 million broadband speed tests from across Pennsylvania and found that median speeds across most areas of the state did not meet the FCC’s criteria to qualify as a broadband connection.
The research also found that connectivity speeds were much slower in rural counties than in urban counties.
By combining 2018 data with an archive of an additional 15 million broadband speed tests from Pennsylvania residents, the research team identified that, since 2014, the discrepancy between reported broadband availability and the speed test results collected through the research has grown substantially in rural areas. This could indicate a regular and growing overstatement of broadband service in rural communities.
The research notes that Internet Service Providers face several challenges to deploying broadband in rural areas, such as geography, population density, and access to infrastructure. However, the research also highlights options for government, private businesses, and community organizations that want to support the universal availability of broadband throughout Pennsylvania. The research also cites several examples of how private and public entities can work together to deploy broadband more fully.
A copy of the research, Broadband Availability and Access in Rural Pennsylvania, and links to the tools and data used as part of the research are available here.
Youth Overweight/Obesity Rates Remain Steady
The percent of overweight students and students who are at-risk of being overweight in Pennsylvania has remained steady at about 32.6 percent, on average, over the 10-year period of 2005-2016, according to recent research sponsored by the Center for Rural Pennsylvania. The research, conducted in 2018, found that the percent of students in the at-risk category is 15.7 percent, on average, and the percent of students in the overweight category is 17 percent, on average.
The research was conducted by Dr. Shailendra Gajanan and Dr. Lisa Fiorentino of the University of Pittsburgh-Bradford. The researchers used data from the Pennsylvania Departments of Education and Health, and the U.S. Census Bureau to compare historical trends in childhood obesity at the school district level with various socio-economic variables, such as education, income, and employment, and various school district variables, such as PSSA scores and participation in the free and reduced school lunch programs. The researchers used the data to identify any relationships between those indicators and obesity rates among Pennsylvania public school students
According to the research results, the percent of rural students in grades K-6 who are overweight consistently exceeded those in urban districts by at least 3 percentage points. Over the 10-year study period, about 19 percent of rural students and 16 percent of urban students, on average, are overweight.
The percent of overweight students in rural school districts in grades 7-12 also consistently exceeded those in urban districts by at least 4 percentage points. On average, about 21 percent of rural students and 17 percent of urban students in these grades are overweight.
These results indicated that youth obesity is a serious concern in Pennsylvania, particularly among rural students, and rural students in grades 7-12.
Overall, lower educational attainment levels, lower employment rates, lack of health insurance, and poverty status among adults are key economic variables that are positively associated with youth overweight status. The incidence of youth overweight status declines as family income increases.
However, when comparing rural districts with urban districts, the research found many more demographic, economic, and school district indicators that are strongly correlated with overweight status in urban districts. A primary reason for the lack of strong correlates in rural districts is the level of homogeneity in rural districts, as there is very little variation in population composition, employment outcomes, and income distribution. Urban districts tend to be more diverse and reveal more variation across all indicators.
Click here for a copy of the research report, Analysis of Obesity Rates for School Children in Pennsylvania.
Chairman's Message
Almost 15 years have passed since Pennsylvania focused so much attention on broadband deployment. Act 183 of 2004 modified Chapter 30 provisions of the Public Utility Code to spell out how broadband would be deployed throughout the state. Back then, broadband was defined as download speeds of 1.544 megabits per second (Mbps) and upload speeds of 128 kilobits per second (Kbps). That definition remains the benchmark today for Pennsylvania. However, technology has come a long way, as those speeds are no longer considered to be true broadband. Today, the Federal Communications Commission (FCC) defines broadband as a minimum of 25/3 Mbps.
No one can deny the importance of high speed connectivity in today’s global society. And, as we’ve heard over the past few years, many residents in Pennsylvania do not have quality access to broadband and are missing out on economic, educational, health care and recreational opportunities. For example, at the Center-sponsored hearing on broadband access in Wellsboro, Tioga County, in 2018, the board heard from economic development representatives, a public school administrator, health care providers, tourism organizations, and an agri-business owner who talked about the lack of broadband in their areas and its effect on their day-to-day operations. The personal stories and experiences shared by the presenters painted a pretty good picture of the shortfalls in broadband accessibility in many of our rural communities.
The Center’s recent report on broadband access and availability, highlighted on Page 1, provides, in a very visual way, the varying levels of actual connectivity speeds that Pennsylvanians experienced while participating in a broadband test. The maps produced from these tests show that a digital divide in Pennsylvania is real, and that connectivity speeds are substantially slower in our rural counties.
The research clearly acknowledges there are a host of reasons why it has been difficult to deploy higher speed broadband to all of our rural areas. Topography, infrastructure access, population density and even consumer ability to pay all contribute to the current situation. However, the Penn State-led team of researchers point out there are examples where unique partnerships, cooperative initiatives, and support from federal, state and local governments, private businesses, and nonprofits are working to bring universal, high-quality broadband to all Pennsylvanians.
As with the diversity of Pennsylvania €“ being a complex blend of urban and rural €“ there is no single solution, no one way to address the challenge of quality, high-speed broadband connectivity. Innovation and entrepreneurship from both the public and private sectors are key to taking that challenge and making it an opportunity. The Center for Rural Pennsylvania will continue its efforts to support that process by providing quality research findings on matters that are important to Pennsylvania.
Senator Gene Yaw
Rural Snapshot: 2017 Census of Ag Results
Data source: 2017 Census of Agriculture, USDA National Agricultural Statistics Service. Note: Data on the characteristics of farmers include only primary producers, or the person who made the most decisions for the farm. Note: The Census of Agriculture is a complete count of U.S. farms and ranches and the people who operate them. The Census of Agriculture, taken only once every 5 years, looks at land use and ownership, operator characteristics, production practices, income and expenditures. Click here for more information from USDA’s National Agricultural Statistics Service.
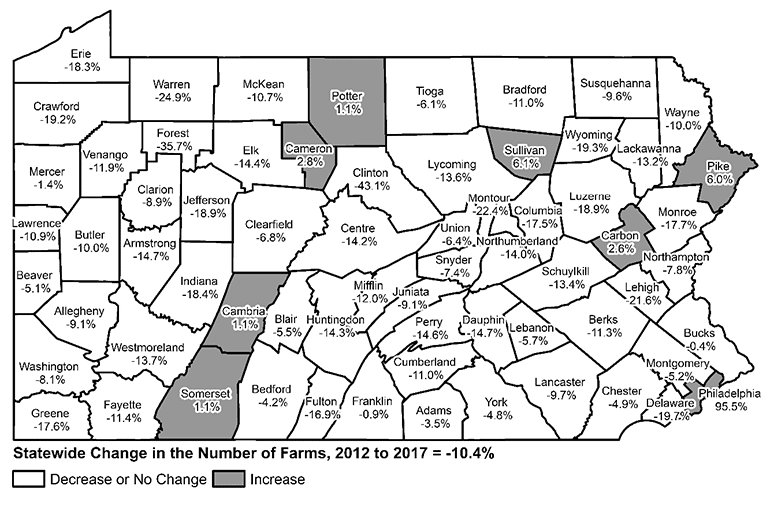
Percent Change in the Number of Pennsylvania Farms, by County, 2012 to 2017
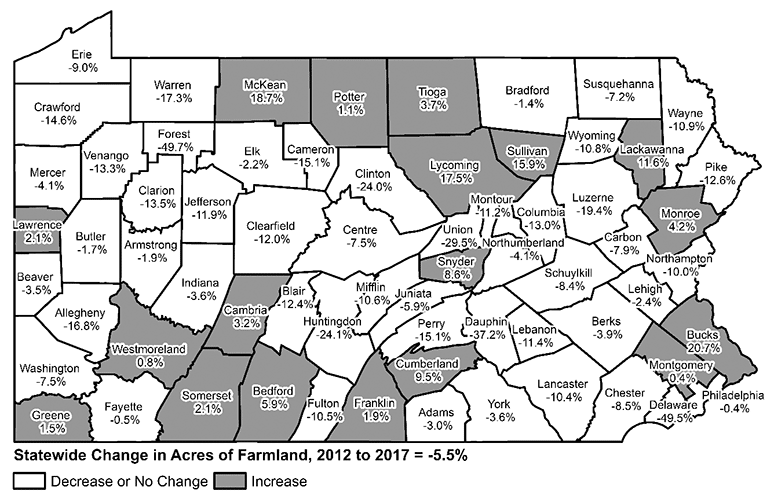
Percent Change in the Number of Acres of Pennsylvania Farmland, by County, 2012 to 2017
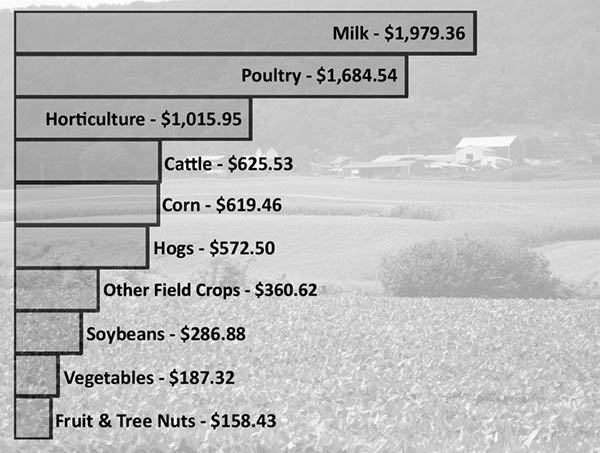
Pennsylvania's Top 10 Commodities, 2017 (Sales in Millions)
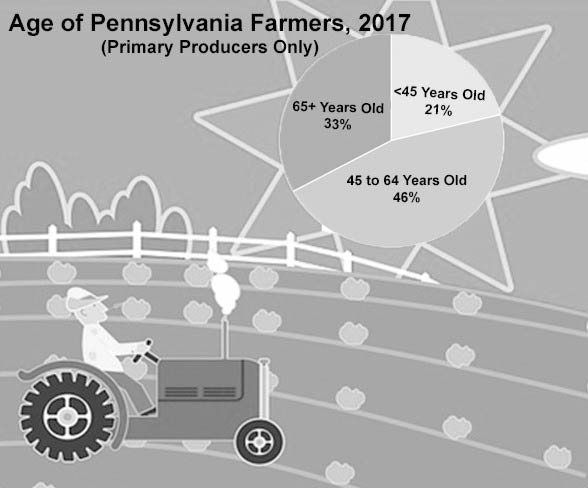
Age of Pennsyvlania Farmers, 2017
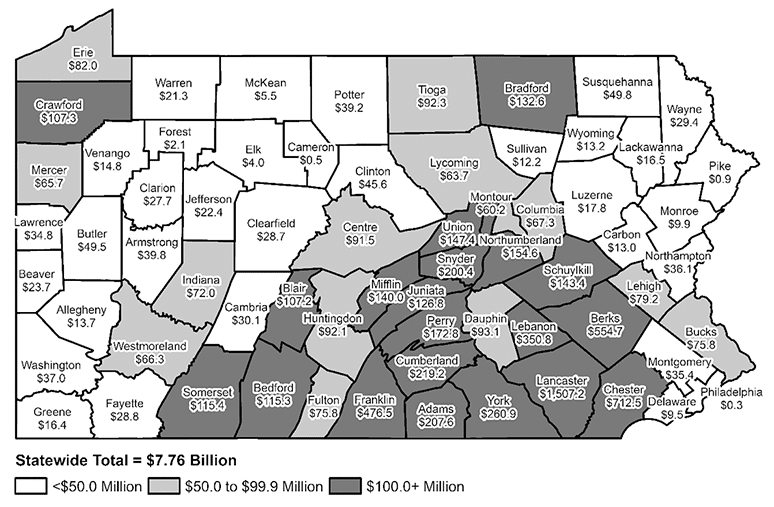
Total Ag Sales by Pennsylvania County, 2017 (in Millions)
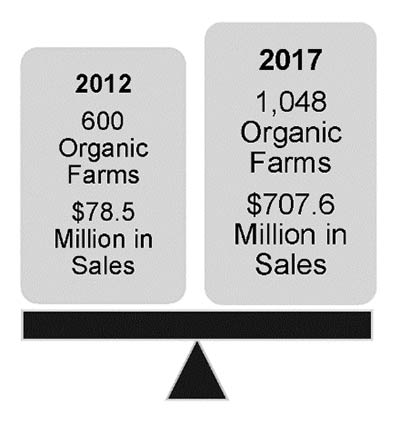
Pennsylvania Organic Farms and Farm Sales, 2012 and 2017
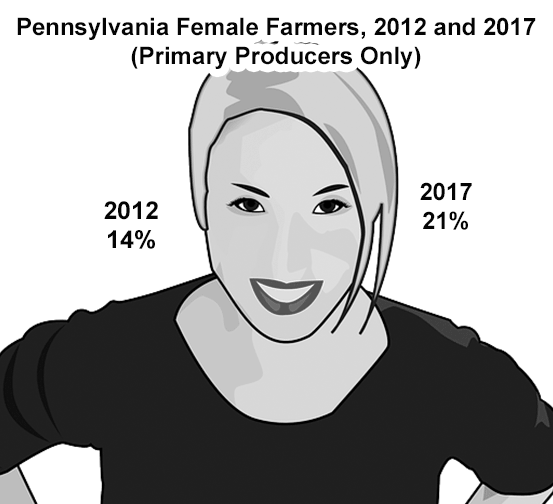
Pennsylvania Female Farmers, 2012 and 2017

In 2017, 6,403 farmers participated in farmers' markets, roadside stands, CSAs, or other similar direct sales to consumers. These activities generated more than $173.8 million in sales.
2020 Census: What's in it for me?
Once a decade, every resident in the U.S. is asked to take part in the U.S. Census. The decennial census, which is mandated by the U.S Constitution, counts our nation’s population and households.
Here are 15 ways that Census data are used and how that data affect you and your community.
- Distribute more than $675 billion in federal funds
- Draw federal, state and local legislative districts
- Support rural development
- Attract new businesses to states and local communities
- Forecast future transportation needs
- Plan for hospitals, nursing homes, clinics, and other health services
- Forecast future housing needs
- Direct funds for services for people in poverty, people with disabilities, the elderly, and children
- Design public safety strategies
- Analyze local trends
- Estimate the number of people displaced by natural disasters
- Create maps to speed emergency services
- Plan future government services
- Facilitate scientific research
- Spot trends in the economic well-being of our nation and states
Click here for more information on the 2020 Census.
Spotted Lanternfly Quarantine Expanded
The Spotted Lanternfly (SLF) quarantine zone has been expanded to Dauphin County. The quarantine zone, last expanded in November 2017, now includes Berks, Bucks, Carbon, Chester, Dauphin, Delaware, Lancaster, Lebanon, Lehigh, Monroe, Montgomery, Northampton, Philadelphia, and Schuylkill counties.
On March 15, the Pennsylvania Department of Agriculture expanded the quarantine to Dauphin County after receiving reports of a population of SLF in the county and actively surveying and treating the area. The department has joined forces with Penn State University and Extension, and the U.S. Department of Agriculture (USDA) to control and contain the spread of SLF.
Penn State University is leading the research efforts currently underway to answer many questions about the insect’s biology, and the ability of the insect to adapt to the environment in Pennsylvania. USDA and the department are actively treating locations where SLF has been reported.
The department is also surveying all counties in the state outside of the quarantine looking for SLF.
The quarantine gives the department the authority to regulate the movement of commodities that may be moving within or leaving the quarantine zone. It restricts the movement of articles that contain any life stages of SLF, including egg masses, nymphs, and adults. Businesses operating in the quarantine zone must have permits to move equipment and goods within and out of the zone.
To determine if your business or organization is required to carry permits, visit Penn State Extension at https://extension.psu.edu/spotted-lanternfly-permit-training.
The department is also encouraging all communities and homeowners to help contain the spread of this invasive pest. For more information, visit the department’s website at https://www.agriculture.pa.gov/Plants_Land_Water/PlantIndustry/Entomology/spotted_lanternfly/Pages/default.aspx, and Penn State Extension’s website at https://extension.psu.edu/spotted-lanternfly-management-for-homeowners.
Just the Facts: Female and Male Small Town Municipal Officials
One in five Pennsylvania small town elected officials is female, according to a recent survey by the Center for Rural Pennsylvania. The 2018 survey of elected officials in municipalities with fewer than 2,500 residents found that 20 percent of municipal officials were female and 80 percent were male. A nearly identical survey done in 1999 found that 14 percent of small town municipal officials were female and 86 percent were male.
The survey results found a number of key differences between female and male small town officials. For example, females were in office for 9 years, on average, while males were in office for nearly 12 years, on average.
Additionally, a higher percentage of females (38 percent) had a bachelor’s degree or higher than male officials (26 percent). Female officials also were more likely to volunteer in the community (81 percent) than male officials (72 percent).
However, male officials were more likely to attend municipal training classes (52 percent) than female officials (39 percent).
When asked why they ran for local office, 12 percent of female officials said they initially ran to maintain streets and highways compared to 34 percent of male officials. Twenty percent of female officials threw their hat into the ring to control taxes and spending compared to 33 percent of male officials.
There were a number of similarities between female and male small town municipal officials. For example, there was no significant difference in the average age of female officials (61.3 years old) and male officials (62.0 years old). There was also no significant difference in the number of hours they spent on municipal business; 80 percent of females spent less than 20 hours per week on municipal business and 76 percent of males spent less than 20 hours per week on municipal business. Also, in their last election, 49 percent of female officials and 55 percent of male officials said they ran unopposed.
On issues facing the municipality, both female and male officials were on the same page. There were, however, some differences. Males ranked streets and highway, and taxes and spending higher than females, while females ranked recreation, and economic development higher than males.
Click here for a copy of the fact sheet, 2018 Survey of Small Town Municipal Officials.
