Newsletters
- Home
- Publications
- Newsletter Archive
- Newsletter
May/June 2018
Inside This Issue:
- Research Examines the Cost of Living in Pennsylvania
- Board Approves Research on Spotted Lanternfly, Other Invasive Species
- Chairman's Message
- Rural Snapshot: Aircraft and Aviation
- Did You Know . . . Pennsylvania's Century and Bicentennial Farm Program
- Just the Facts: Adults without a High School Diploma
Research Examines the Cost of Living in Pennsylvania
The cost of living is lower in rural Pennsylvania counties than urban Pennsylvania counties, according to a year-long study conducted by Dr. Kenneth Louie and Dr. James Kurre of Penn State Erie€“The Behrend College. The research also found that the overall cost of living tended to be highest among Pennsylvania counties in the southeastern and southwestern parts of the state.
The research, sponsored by the Center for Rural Pennsylvania and conducted in 2017, is a follow-up to a cost-of-living (COL) study conducted by Kurre on behalf of the Center in 2000.
The current research found that the key factors for the cost of living to be higher in some areas than others are income, population density, and the overall population in an area.
Research background
This research provides new and current data on the cost of living in Pennsylvania’s rural and urban areas. It explored several important issues, including whether the rural COL advantage still exists, if it has increased or dwindled, why it exists, and how Pennsylvania compares on the urban-rural cost differential with two other peer states, namely Ohio and Florida.
Cost-of-living data
The researchers used data from the Cost of Living Index (COLI), which is from the Council for Community and Economic Research (C2ER).
C2ER uses raw price data collected from approximately 300 urban communities each quarter to compute an index with the base of 100 equaling the average for the communities nationwide. Data are available for the overall cost of living in urban areas, and for six subcategories: groceries, housing, utilities, transportation, health care, and miscellaneous goods and services.
The researchers also used a statistical approach developed by Kurre to estimate the cost of living in rural counties, since the traditional COLI only provided data for urban areas and larger communities and not for rural areas.
Research results
Overall, the research found that Pennsylvania’s rural counties have a lower cost of living than urban counties for five of the six categories included in the research: groceries, housing, transportation, health care, and miscellaneous goods and services. In the housing category, costs for housing were significantly lower in rural areas than in urban areas. This is especially important since housing typically makes up about one quarter to one third of a family’s budget. For the utilities category, costs were higher in rural counties than in urban counties.
When population was considered (to account for the larger number of people living in higher-cost urban areas), the research found that urban residents pay 10.9 percent more, on average, than rural residents for their cost of living. In the housing category, urban residents pay about 32.7 percent more, on average, than rural residents.
The overall cost of living tended to be highest among Pennsylvania counties in the southeastern and southwestern parts of the state.
When comparing Pennsylvania’s cost of living to other states nationwide, the research found that, on a population-weighted basis (again to account for the larger number of people living in higher-cost urban areas), Pennsylvanians pay about 10.7 percent more overall, on average, than other Americans.
Housing again was the key category driving the higher overall COL in the state, since Pennsylvanians pay 26.8 percent more, on average, for housing than Americans elsewhere.
Among the other categories, transportation ran 12.3 percent above average in Pennsylvania compared to the rest of the nation, utilities ran 11.8 percent above average, miscellaneous goods and services were 7.6 percent above average, and groceries were 6.5 percent above average. Health care was 6.2 percent lower than the U.S. average cost. The researchers note that this does not necessarily mean that health care costs in Pennsylvania have fallen; instead they probably have not increased as much here as in other states in the nation.
Peer state comparisons
The research included both Ohio and Florida as peer states for comparison because they are similar to Pennsylvania in population, the number of counties, the percent of counties that are rural, and mean household income.
Of the three states, Pennsylvania is the highest cost state and Ohio is the lowest. A key finding is that rural costs are lower than urban costs in all three states. Also, the housing category is the sector driving the overall cost of living and the urban-rural differential in all three states. The urban-rural housing differential ranged from 16 percent in Florida to 29 percent in Ohio to 33 percent in Pennsylvania, after adjusting for population differences across counties.
In all three states, the utilities category did not follow the general pattern of the other cost-of-living categories, with urban costs typically being a few tenths of a percent below rural costs. Both Florida and Ohio exhibited patterns similar to Pennsylvania’s in terms of the causes of cost of living, as income levels played the key role in all three states for the overall cost-of-living index and for five of the six categories, with utilities being the exception in all three states.
Research report available
For a copy of the research report, Analysis of Cost-of-Living Data for Pennsylvania Counties, click here.
Board Approves Research on Spotted Lanternfly, Other Invasive Species
At its April meeting, the Center for Rural Pennsylvania’s Board of Directors awarded two research grants to study invasive species in Pennsylvania. One research project will study the economic impact of the spotted lanternfly and the other will look at response efforts to combat the spread of invasive species in Pennsylvania.
“The spotted lanternfly and other invasive species are threats to Pennsylvania’s agriculture, natural resources and tourism,” said Sen. Gene Yaw, chairman of the Center’s Board of Directors. “The spotted lanternfly has the potential to severely damage Pennsylvania’s natural areas and agricultural commodities, just as other invasive species, plants and animals have already upset Pennsylvania’s ecology and economy. With these research projects, the Center’s board wants to document the current and potential economic damage of the spotted lanternfly, and analyze response efforts to other invasive species.”
For the year-long study, Economic Impact of the Spotted Lanternfly in Pennsylvania, Dr. Jayson Harper of Pennsylvania State University will estimate the economic impact of the spotted lanternfly on Pennsylvania agriculture and forests by analyzing data from a variety of sources, including the Census of Agriculture, to determine the pest’s impact on crops and forests. He will also estimate the cost of managing the spotted lanternfly by commercial growers.
For the nine-month study, Legislative and Regulatory Efforts to Control Invasive Species, Dr. Sara A. Grove of Shippensburg University of Pennsylvania will assess government efforts to control the impact and spread of invasive species. She and her team will identify existing statutes, regulations and funding streams related to the control of invasive species, and will also evaluate the outcomes of the statutory and regulatory practices to control invasive species at the state and federal levels.
For more information about the Center’s Research Grant Program, click here.
 Left to right: Center Director Barry Denk, Center Board Chairman Sen. Gene Yaw and Center Board Vice Chairman Rep. Garth Everett. |
 Left to right: Center Board Treasurer Rep. Sid Michaels Kavulich, Center Board Member Steve Brame and Center Board Member Darrin Youker. |
Chairman's Message
More than 800,000 Pennsylvanians do not have access to fixed, broadband internet service, according to 2016 data from the Federal Communications Commission. A large number of those Pennsylvanians live in our rural counties. According to the FCC data, 69 percent of the population in Sullivan County, 31 percent of the population in Forest County, 60 percent of the population in Fulton County, and 30 percent of the population in Potter County do not have access to broadband, which is defined as 25 megabits per second as the minimum download speed and 3 megabits per second as the minimum upload speed.
To learn more about the challenges and opportunities regarding broadband deployment in rural Pennsylvania, the Center’s board sponsored a public hearing in Wellsboro on April 5. Senate President Pro Tempore Joe Scarnati and Representative Martin Causer joined the Center’s board and Director Barry Denk to hear from broadband service providers and consumers about the issues, challenges, and opportunities of delivering broadband services in rural Pennsylvania.
More and more people are realizing how important broadband access is these days, and how our rural communities are missing out on many opportunities because of their lack of access. I’ve said before that the geography of rural Pennsylvania and the lack of population are issues that affect the availability, access and cost of broadband. But I’ve also said how rural Pennsylvania can serve as a testbed for innovation and unique ways of dealing with the challenges of geography and isolation.
If you would like to watch a video of the hearing or read the submitted testimony, click here.

Center board members, staff and guests at a public hearing on rural broadband access and affordability on April 5 at the Penn Wells Hotel, Wellsboro, PA.
Senator Gene Yaw
Rural Snapshot: Aircraft and Aviation
Data sources: Federal Aviation Administration: Airport Data and Contact Information; Aircraft Registry; Airman Certification; and Geographic Listing of USA Registry Enrollments and Registrants.
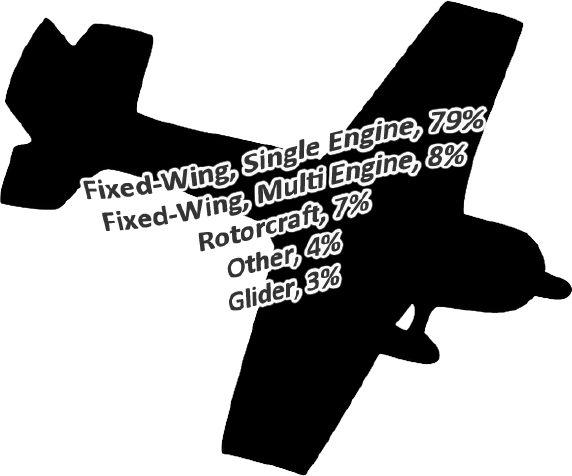
Types of Aircraft in Rural Pennsylvania, 2018
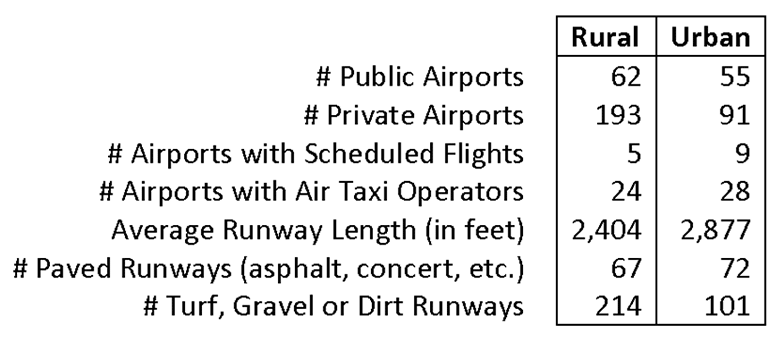
Number & Type of Aviation Facilities in Rural and Urban Pennsylvania, 2018

*Area for airplanes to take-off/land in water (lakes, rivers, etc.)
Rural and Urban Pennsylvania Airports, 2018
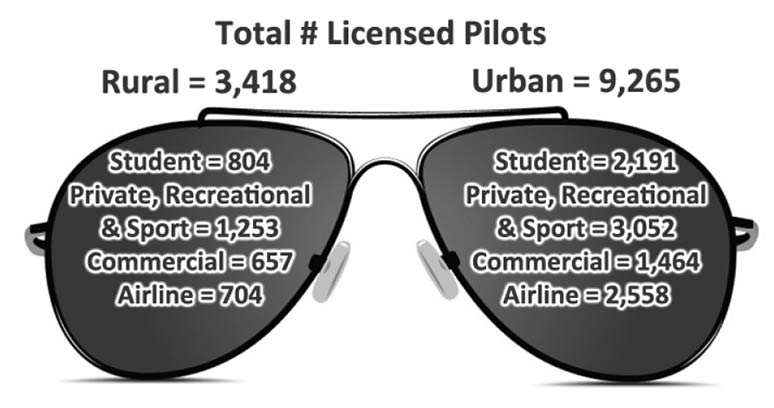
Licensed Pilots in Rural and Urban Pennsylvania, 2018
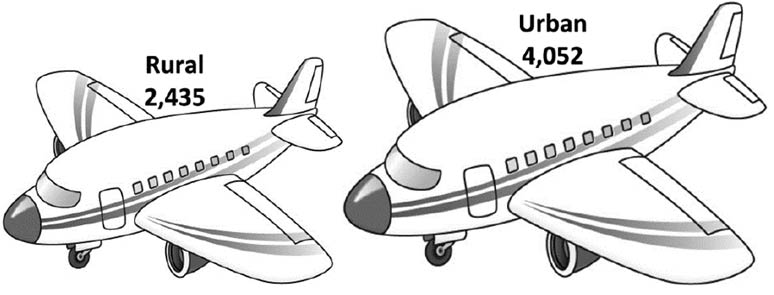
Number of Aircraft Registered in Rural and Urban Pennsylvania, 2018
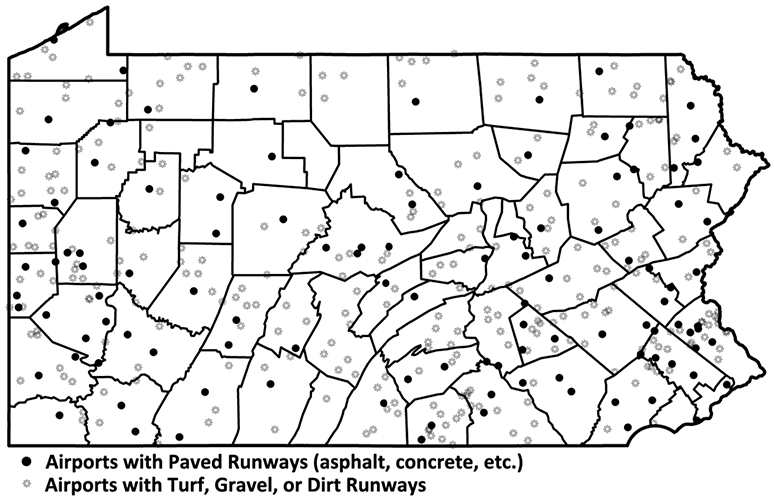
Airports in Pennsylvania by Type of Runway, 2018
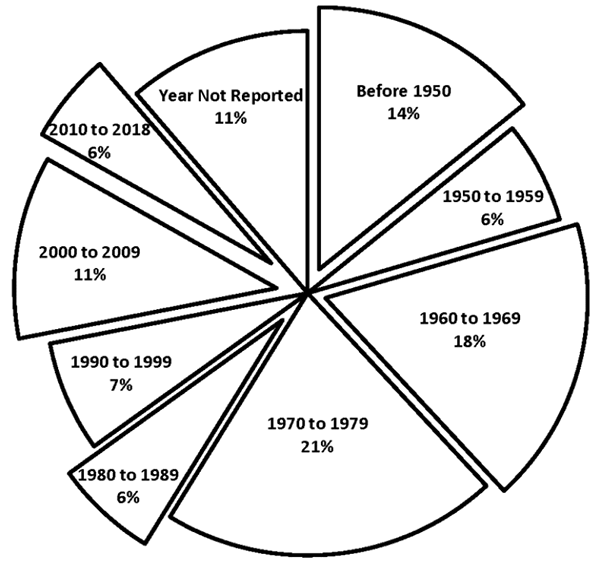
Aircraft in Rural Pennsylvania, by Year Manufactured, 2018
Number of Drones Registered in Rural and Urban Pennsylvania, 2018*
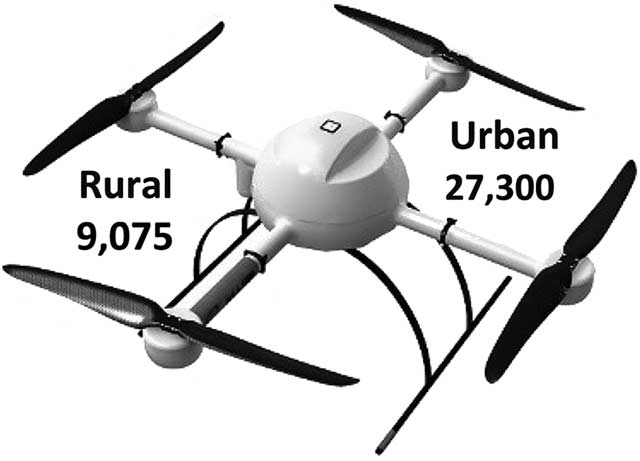
*The Zip Code for six drone owners could not be geocoded as rural or urban.
We got it wrong: this graph was updated to show that the number of registered drones in urban Pennsylvania is 27,300, not 27,301.
| States with the Most Registered Drones, 2018 | |
|---|---|
| California | 144,150 |
| Texas | 84,194 |
| Florida | 80,979 |
| New York | 50,618 |
| Pennsylvania | 36,381 |
| Illinois | 34,486 |
| Ohio | 32,703 |
| Washington | 31,369 |
| Michigan | 30,426 |
| Georgia | 30,569 |
Did You Know . . . Pennsylvania's Century and Bicentennial Farm Program
- The Pennsylvania Department of Agriculture recognizes Pennsylvania farms and farm families who have been farming the same land for 100 and 200 years with the Century and Bicentennial Farm Program.
- The Century Farm Program started in 1977.
- The Bicentennial Farm Program started in 2004.
- As of April 2018, the Pennsylvania Department of Agriculture has recognized more than 2,100 century and 180 bicentennial farms in Pennsylvania.
- Century farms have been recognized in every county, except Philadelphia.
- Bicentennial farms have been recognized in 40 of Pennsylvania’s 67 counties.
- More than 245 farms recognized by the program were established in the 1700s.
Just the Facts: Adults without a High School Diploma
In 1990, more than 27 percent of adults (age 25+) in rural Pennsylvania did not have a high school diploma or equivalent, according to Census Bureau data. By 2016, the rate dropped 16 percentage points to 11 percent. In urban areas there was a similar decline.
While this decline is remarkable, rural adults still have lower educational attainment levels than urban adults.
To understand the characteristics of the approximately 273,700 rural Pennsylvania adults and 573,300 urban Pennsylvania adults who do not have a high school diploma or equivalent, the Center analyzed data from the 2016 American Community Survey, Public Use Microdata Sample (ACS-PUMS).
The analysis included adults who were 25 years old and older without a high school diploma or equivalent and who were not enrolled in school. People in an institution, such as prison or a nursing home, were excluded from the analysis. Here are the results:
- Rural adults were 59 years old, on average, and urban adults were 57 years old, on average.
- 52 percent of rural adults were male and 48 percent were female. 49 percent of urban adults were male and 51 percent were female.
- 6 percent of rural adults and 37 percent of urban adults were non-white.
- 6 percent of rural adults and 22 percent of urban adults were not born in the U.S.
- 12 percent of rural adults spoke a language other than English at home and 34 percent of urban adults spoke another language at home.
- 39 percent of rural adults and 37 percent of urban adults had a disability.
- 33 percent of rural adults were employed, 3 percent were unemployed, and 64 percent were not in the labor force. 36 percent of urban adults were employed, 4 percent were unemployed and 60 percent were not in the labor force.
- The median wage for rural adults who worked full-time and year-round was $34,258. For urban adults working full-time, year-round, the median wage was $30,228.
- 23 percent of rural adults and 25 percent of urban adults were in poverty.
- The top three industries in which rural adults were employed were manufacturing (18 percent), construction (12 percent) and retail (12 percent). For urban adults, the top three industries were the same: manufacturing (17 percent), construction (12 percent) and retail (12 percent).
