Newsletters
- Home
- Publications
- Newsletter Archive
- Newsletter
May/June 2017
Inside This Issue:
- Research Analyzes PA Crash Statistics
- Impact of Increasing the Minimum Wage in Pennsylvania
- Chairman's Message
- Rural Snapshot: Pennsylvania Population Change
- Tying the Knot: A Look at Rural and Urban Newlyweds
- Fast Fact: Supermarkets and Other Establishments Licensed to Sell Wine
- Just the Facts: Car Colors
Research Analyzes PA Crash Statistics
About 29 percent of all injury and fatal crashes in Pennsylvania occur in rural areas, with 46.5 percent resulting in fatalities and 37.7 percent resulting in injuries, according to recent research conducted by faculty of Indiana University of Pennsylvania and sponsored by the Center for Rural Pennsylvania.
The research also found that rural areas tend to have a higher share of crashes with major injuries and moderate injuries than urban areas, and that fatality rates are higher in rural areas than in urban areas even when a seat belt or child safety seat is used.
Research Background
Dr. Louis Pesci, Jeffrey Grim, Lucas Tatarko and Joseph Franze of Indiana University analyzed vehicle crashes in Pennsylvania to determine if there are any differences in the number or severity of crashes between rural and urban Pennsylvania.
The researchers analyzed vehicle crash data from 2010-2015 from the Pennsylvania Department of Transportation and examined the demographic profile and causes of crashes for individuals in Pennsylvania by age group, specifically for younger and older drivers, by rural and urban municipality, and by proximity to emergency service providers, local police, Pennsylvania State Police stations, hospitals, and trauma center hospitals in Pennsylvania.
Results
Overall, the research, which was conducted in 2016, found that in both rural and urban areas: the highest percentage of crashes with an injury or fatality occurs on state highways, followed by local roads or streets; males are two times more likely than females to be in a crash with a fatality; and drugs and/or alcohol were not suspected in the majority of fatal crashes.
The research also found that about 94 percent of all injury and fatal crashes in rural areas occur in townships of the second class, which is not surprising since these municipalities cover about 98 percent of rural Pennsylvania and include 88 percent of the rural population. In urban areas, a plurality of injury and fatal crashes occurred in cities and townships of the second class.
In both rural and urban areas, crashes on dry roads are more likely to involve a fatality than crashes on roads that are wet, snow covered, icy or slushy.
The majority of crashes in both rural and urban areas occur during daylight hours. Not surprisingly, a higher percentage of crashes in rural areas occur on dark streets with no street lights than in urban areas.
In both rural and urban areas, the highest percentage of those involved in injury and fatal crashes are those aged 25 to 34. In rural areas, a higher percentage of young drivers is involved in moderate and major injury and fatal crashes than young drivers in urban areas.
The research also found that crash sites that are more than 31 minutes from a trauma center have a higher percentage of fatalities than those within 15 minutes of a trauma center. This finding supports the “Golden Hour” concept, which is used by emergency medical services to describe the concept of bringing severely injured trauma patients and surgeons together as quickly as possible to increase the patients’ chances of survival.
Report Available
Click here for a copy of the report, Analysis of Pennsylvania Crash Statistics Data.
Impact of Increasing the Minimum Wage in Pennsylvania
Raising the minimum wage from $7.25 per hour to $9 per hour in 2017 would affect an estimated 844,577 Pennsylvania workers, according to research conducted by Todd Behr, Dr. Constantinos Christofides and Dr. Pattabiraman Neelakantan of East Stroudsburg University of Pennsylvania. The research, The Impact of Raising the Minimum Wage in Rural and Urban Pennsylvania, indicated that 310,376 rural and 534,201 urban residents would be directly and indirectly affected by a proposed increase in the minimum wage from $7.25 to $9 in 2017.
The research, which was sponsored by the Center for Rural Pennsylvania, used data from the 2014 American Community Survey (ACS) Public Use Micro-data Sample (PUMS). It found that while most minimum wage workers would receive an increase in income, the increase could also lead to job losses ranging from 7,650 to 15,300, out of which 2,780 to 5,559 would be in rural areas, and 4,870 to 9,741 would be in urban areas.
The researchers also explored the effects of raising the minimum wage to $10.10 per hour. They found that this option would cause more significant effects on both employment and income since a much larger number of people would be affected. If the minimum wage is increased to $10.10 in 2017, the number of directly and indirectly affected workers is estimated to reach 1,201,352, comprising 438,799 rural workers and 762,553 urban workers. Job losses under the $10.10 option would range from a low of 28,667 to a possible high of 57,334, out of which 10,396 to 20,792 would be in rural areas, and 18,271 to 36,542 would be in urban areas.
The net gains resulting from an increase in the minimum wage from $7.25 to $9.00 in 2017 are estimated to exceed $700 million for wage and salary workers in Pennsylvania. The $10.10 option may produce net income gains of over $2 billion. These gains would probably be lower than predicted because business profits may decrease due to higher labor costs pushing prices of goods and services higher, and sales lower. It is estimated that 2,634 rural and 7,269 urban Pennsylvania households may be lifted out of poverty if the minimum wage is raised to $9 in 2017. The $10.10 option may lift as many as 7,547 rural households and 21,347 urban households out of poverty.
The research also estimated that federal government expenditures on healthcare, cash assistance and tax credit programs may decrease by $90 million under the $9 option and by $262 million under the $10.10 option.
The research determined that rural and urban minimum wage earners were very similar. They were mostly female, white, younger, never married, with a high school diploma or less, English speaking, driving to work, and commuting less than 15 minutes to work.
The research also found that most minimum wage workers in Pennsylvania worked in the Accommodation and Food Services, Retail Trade, and Healthcare and Social Assistance industries. The occupations with the most significant numbers of minimum wage workers were: Food Preparation and Serving Related, Sales and Related, Office and Administrative Support, and Transportation and Material Moving Occupations. There seemed to be no significant industrial or occupational differences between rural and urban minimum wage earners in Pennsylvania.
Chairman's Message
If you haven’t visited the Center for Rural Pennsylvania’s website recently, I encourage you to take a tour at www.rural.palegislature.us. The data, research, and other information available on the website will quickly demonstrate why the Center is often referred to as a “one-stop-shop” for fact-based and balanced research and data on rural trends and conditions. The Center’s data and research are regularly used and referenced by a wide variety of individuals and organizations, including members of the Pennsylvania General Assembly, state and local municipal officials in Pennsylvania and across the nation, the media, nonprofit organizations, businesses, and educators.
The Center for Rural Pennsylvania consistently provides valuable information on all things rural. For policy makers at all levels of government, there’s no question that sound decision making occurs best when people are informed about the issues, understand the implications of potential program and policy decisions, and can compromise on suitable or appropriate solutions. That’s why the Center’s data and research continue to cover a wide range of issues and topics €“ like those featured above.
The research on the impact of minimum wage increases was conducted in response to current discussions at both the state and national levels on increasing the minimum wage. The results provide good information on how increasing the minimum wage may impact employees, employers and government expenditures.
The research to analyze crash statistics data was conducted to provide baseline information on the number and severity of rural and urban vehicle crashes. The results help us to better understand where, when and under what conditions crashes may occur and point to additional data gathering and research that could be helpful.
In addition to research and data, the Center’s website also includes a list of timely resources, such as grants, loans and technical assistance, which may be helpful to organizations statewide, and a calendar filled with state and national conferences, workshops, webinars and events.
As always, if you don’t see what you’re looking for on the Center’s website and need more specific information about our data or research results, call the Center staff at (717) 787-9555.
Finally, as we look to celebrate this coming Memorial Day, let us remember to show our appreciation for our military men and women who bravely defended our freedom. Whenever you have the opportunity, please remember to honor our veterans who have passed on and to say thank you to those who are still with us to let them know their service to our country will never be forgotten.
Senator Gene Yaw
Rural Snapshot: Pennsylvania Population Change
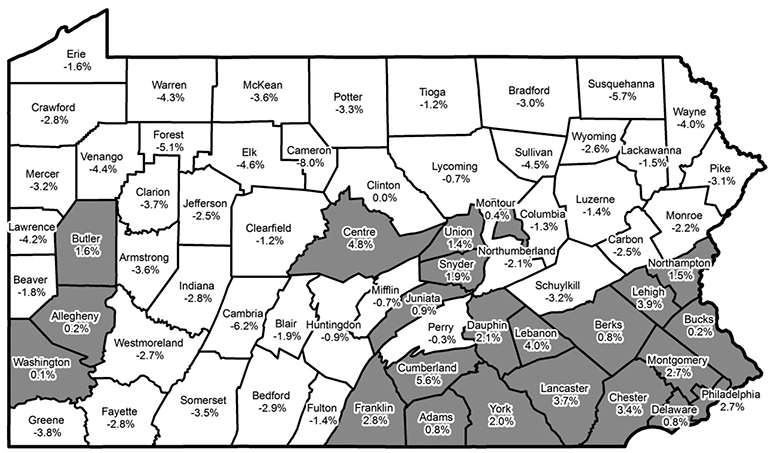
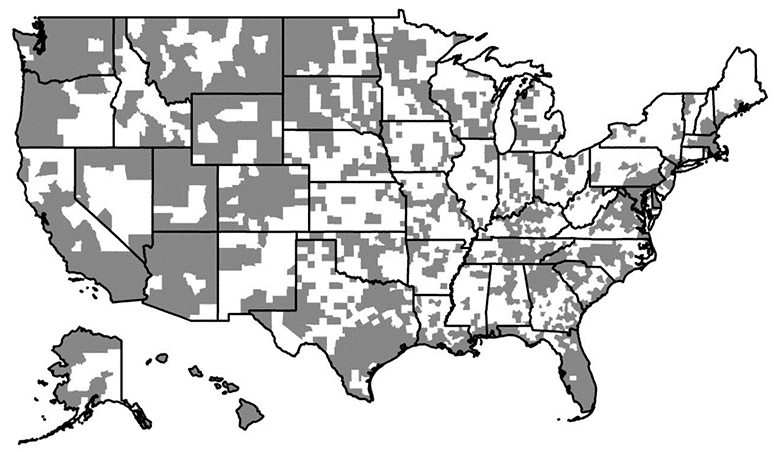
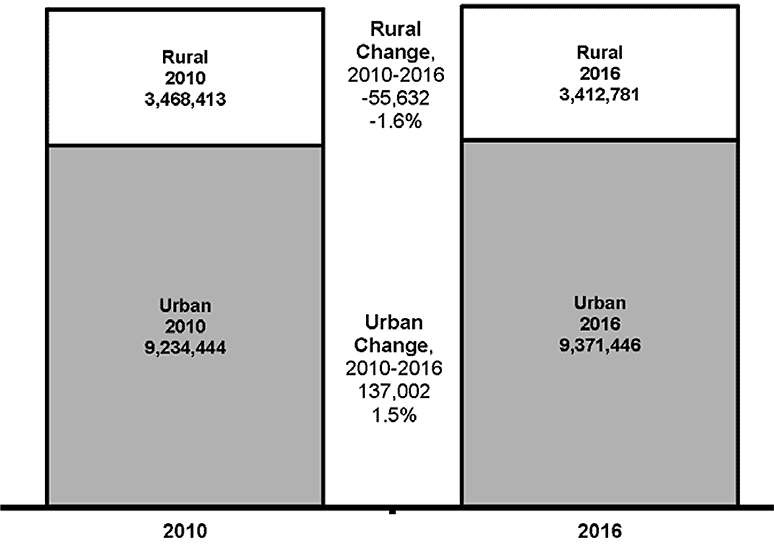
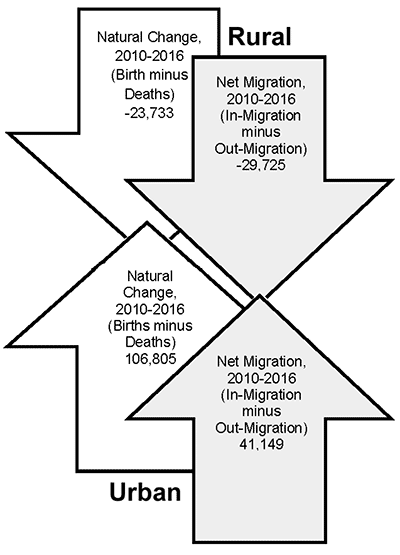
Data source: 2016 Population Estimates, U.S. Census Bureau. Note: Total population change includes a residual. A residual represents the change in population that cannot be attributed to any specific demographic component, such as births, deaths, and net migration.
Pennsylvania Population Change by County, 2010 to 2016
U.S. Population Change by County, 2010 to 2016
Population Change in Rural and Urban Pennsylvania, 2010 to 2016
Elements of Population Change in Rural and Urban Pennsylvania, 2010-2016
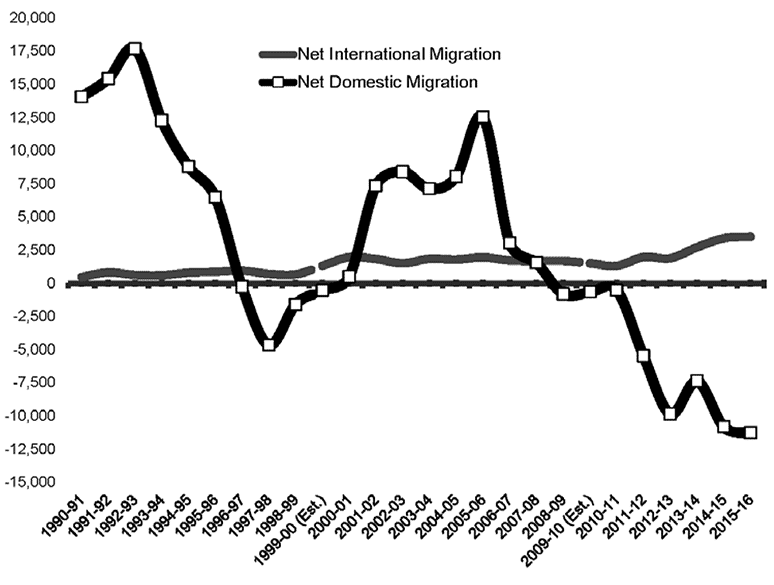
Rural Pennsylvania Net International and Domestic Migration, 1990 to 2016

Tying the Knot: A Look at Rural and Urban Newlyweds
According to the wedding website, TheKnot.com, June, August, September and October are the most popular months for weddings.
In 2015, approximately 45,400 rural Pennsylvanians and 120,400 urban Pennsylvanians tied the knot, according to the data from the U.S. Census Bureau’s 2015 American Community Survey, Public Use Microdata Sample (ACS-PUMS).
Among rural newlyweds, their average age was 35.3. Among urban newlyweds, their average age was 34.5. A closer examination of the ACS-PUMS data shows that 44 percent of rural newlyweds were under 30 years old and 15 percent were 50 years old and older. Among urban newlyweds, 40 percent were under 30 and 12 percent were 50 years old and older.
Seven percent of rural and 5 percent of urban newlyweds lived in a multigenerational household. This is a household that has three or more generations living together.
The median household income for rural newlyweds was $64,481, and for urban newlyweds was $81,803. Seven percent of rural and 8 percent of urban newlyweds lived in poverty.
Seven percent of rural newlyweds and 9 percent of urban newlyweds had a baby within the first 12 months of marriage.
For 67 percent of rural newlyweds, this was their first marriage; 33 percent had been married before. Among urban newlyweds, 82 percent had never been married before and 18 percent had been married once before.
About 60 percent of both rural and urban newlyweds lived in their own home and 40 percent were renters.
Fast Fact: Supermarkets and Other Establishments Licensed to Sell Wine
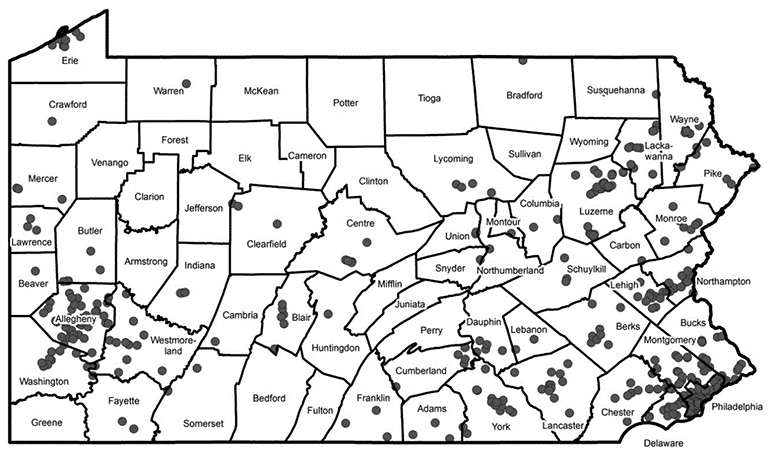
Data source: Pennsylvania Liquor Control Board, data as of April 18, 2017.
Act 39 of 2016 allowed wine sales in licensed grocery stores and other establishments. As of April 18, 2017, there were 408 establishments selling wine to go. Seventy-six percent (309) of these establishments were in urban counties and 24 percent (99) were in rural counties. Nineteen counties, each of which is rural, had no establishments selling wine to go.
Just the Facts: Car Colors
Question: What color are the vehicles in rural Pennsylvania that are least likely to be involved in a crash? Those would be orange and purple. According to 2016 crash data from the Pennsylvania Department of Transportation in which vehicle color was reported, orange and purple vehicles were each involved in less than 1 percent of the more than 53,200 crashes in rural areas.
It’s likely that orange and purple vehicles are not involved in a large percent of crashes because they aren’t popular vehicle colors. According to Motor Trend Magazine’s online newsletter, in 2014, just 10 percent of vehicles in North America were painted orange and neutral tones like gold, beige, and brown. Purple didn’t even make the list.
On the other hand, vehicles with the highest number of crashes in rural Pennsylvania were silver (18 percent), white (16 percent) and black (16 percent). This pattern was nearly the same in urban Pennsylvania. It’s likely that these vehicles were involved in more crashes since these vehicle colors are the most popular. According to Motor Trend Magazine’s online newsletter, in 2014, 23 percent of all new vehicles in North America were white, 18 percent were black, 16 percent were gray and 15 percent were silver.
The crash data from the Pennsylvania Department of Transportation indicated that, from 2005 to 2015, there were a number of shifts in rural vehicle crashes according to color. The percent of crashes involving red and green vehicles declined (2 and 5 percentage points, respectively), while cashes involving black and silver vehicles each increased more than 5 percentage points.
The data indicate that, in rural Pennsylvania, there were also some differences in the color of vehicles and the type of crashes in which they were involved. For example:
- In 21 percent of deer-related crashes, the vehicle color was silver;
- In 16 percent of cell- phone-related crashes, the vehicle colors were either black or red;
- In 18 percent of speed-related crashes, the vehicle color was silver; and
- In 23 percent of work-zone crashes, the vehicle color was white.
The top four colors of vehicles involved in aggressive driving crashes were: silver, with 18 percent; white, with 16 percent; black, with 16 percent; and red, with 13 percent.
The take-away: maybe consider an orange or purple vehicle the next time you’re in the market for a new one.
