Newsletters
- Home
- Publications
- Newsletter Archive
- Newsletter
March/April 2017
Inside This Issue:
- Multi-Year Research Examines Social, Economic Impacts of Natural Gas Development
- Chairman's Message
- Center Board Elects Officers for 2017-2018
- Rural Snapshot: Hospitals and Health Care Providers
- Rural Manufacturing: Down But Not Out
- Fast Facts: Pennsylvania Farm Family Households
- Just the Facts: Rural Female Breadwinners
Multi-Year Research Examines Social, Economic Impacts of Natural Gas Development
When it comes to Marcellus Shale development, discussions about its potential implications for the commonwealth's communities and natural environment run from the good to the bad to everywhere in-between.
A multi-year study conducted by Penn State University researchers on the social and economic impacts of Marcellus Shale development in Pennsylvania will no doubt add to these varied conversations. The longitudinal research, sponsored by the Center for Rural Pennsylvania, indicates that Marcellus Shale development impacts are dynamic and complex, and are influenced heavily by the pace of development, the location of development, and pre-existing characteristics of the population living in and around the area of development. Further, the research found that individuals near the development tend to see the impacts in many ways: it’s not all positive or all negative. It involves tradeoffs.
Research background
In 2012, researchers from Penn State University began to chronicle community changes in four counties €“ Bradford, Lycoming, Greene and Washington €“ to learn more about the social and economic impacts of Marcellus Shale development in Pennsylvania.
The team released the first wave of research results in 2014, which focused on county-level indicators including population, housing, local economies, crime, health and healthcare access, K-12 education, agriculture, and local government.
In this second wave of research, which began in 2014, the team looked to re-examine the impacts on crime, housing, the economy, agriculture, health and health care access, and traffic incidents in relation to Marcellus Shale development. The researchers also conducted interviews with social service providers and low-income residents in the study counties to assess any changes in social support and housing access for low-income families.
Findings
In general, the research results found that there is no one, singular answer to the question “what is the impact of natural gas development?” The research found that impacts vary by geographic location, by point in time, by social group, and by the type of impact that is of interest.
For example, in terms of crime, the research examined overall arrest rates for minor crimes, driving under the influence (DUI), public drunkenness, drug abuse violations, and disorderly conduct. The research found that rates of driving under the influence were higher in counties with high levels of well development compared to counties that did not have well development; however, the counties with high levels of development did not experience an increase in DUIs from before to during Marcellus well development that was greater than other counties.
In terms of health and health care use, the research examined health insurance coverage, health care use, and health outcomes in the study counties and neighboring counties and between counties with no wells, counties with some wells, and counties with the most wells. The study found that counties with the most wells had larger reductions in hospitalizations for respiratory and digestive illnesses, but larger increases for hospitalizations for injuries, poisonings, and toxic effects of drugs. These counties also had larger increases in emergency room visits.
Conclusions
The research concluded that it is important to understand the local effects of development as aggregate trends tend to mask local and more individual experiences.
The research suggests that state policy needs to recognize these local impacts to be more flexible and responsive to local issues, and to be more adaptable as industry and local communities respond to industrial and technological changes. Another implication is that standard methods of public data collection do not match the need to document impacts at very local scales. Comprehensive monitoring at the municipal level is needed, so that attention, resources or programs may be targeted to areas or populations that may be especially affected, particularly in relation to funds, such as impact fees, that are intended to compensate for impacts. The research also suggests that policy approaches are needed that effectively recognize disparities in experiences. Since certain segments of the population are more vulnerable to rapid economic and industrial change, policies need to consider mechanisms that will help groups that may be negatively affected, and offer security for those who are most vulnerable.
For a copy of the research results, The Marcellus Shale Impact Study Wave 2: Chronicling Social and Economic Change in Northern and Southwestern Pennsylvania, and the seven topical reports on crime, economic changes, housing, agriculture, health, traffic, and low-income individuals, visit www.rural.palegislature.us/publications_reports.html.
Chairman's Message
As noted in the article on Page 1, opinions and ideas about the impact of Marcellus Shale development run far and wide. But whether you are for it, against it, or somewhere in between, you have to admit that the development has brought about considerable change across the commonwealth.
Since development has been especially prevalent in our rural communities, the Center for Rural Pennsylvania has taken a keen interest in the development’s impact in our rural communities. I should note that while the Center has no position on development itself, it is highly interested in data and research on how the development may be affecting our rural communities and our rural residents. That is why it contracted with researchers from Penn State University in 2012 to start a multi-year research project on Marcellus Shale development. The research goal was to help document the economic, community and social changes that Marcellus Shale development has brought to the commonwealth, mostly by focusing on four rural counties €“ Bradford and Lycoming in the north and Greene and Washington in the south.
The first wave of the research was published in 2014, and the results indicated that the effects of development were not very consistent across places or time periods.
The team began the second wave of research in 2014, and now, that second wave has been completed. The research again found that, overall, development impacts vary by geographic location, point in time, social group, and topic. The seven research areas examined were crime, economic changes, housing, agriculture, health, traffic, and low-income individuals. The results within each of these research areas included both pluses and minuses, and emphasized the need for public policies that are flexible, responsive to local needs, and adaptable as industry and local communities respond to industrial and technological changes.
The research also emphasized that the standard methods of public data collection are not providing the type of information needed for research at very local levels. The researchers therefore suggested that more comprehensive monitoring at the municipal level is needed.
Visit the Center’s website for a copy of the full report, The Marcellus Shale Impacts Study Wave 2: Chronicling Social and Economic Change in Northern and Southwestern Pennsylvania, as well as the seven topical reports.
Senator Gene Yaw
Center Board Elects Officers for 2017-2018
At its March meeting, the Center for Rural Pennsylvania’s Board of Directors elected officers for the 2017-2018 legislative session.
The board reelected Senator Gene Yaw chairman and Dr. Nancy Falvo secretary. The board elected Representative Garth Everett vice chairman and Representative Sid Michaels Kavulich treasurer.
 |
 |
 |
 |
| Sen. Yaw | Rep. Everett | Rep. Kavulich | Dr. Falvo |
Rural Snapshot: Hospitals and Health Care Providers
Number of Rural and Urban Hospital Beds per 1,000 Residents, 1996-97 to 2014-15
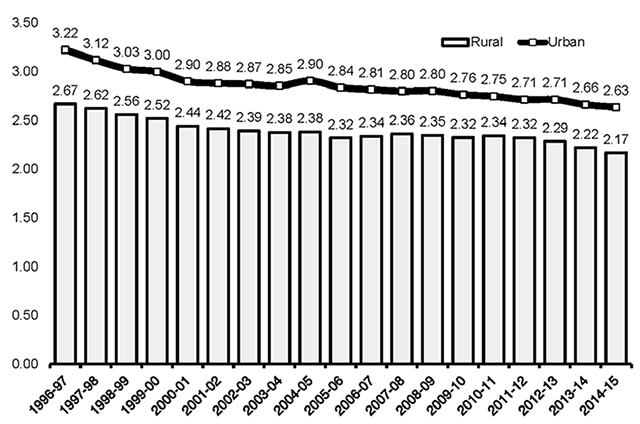
*Number of hospital beds set up and staffed per 1,000 residents. Data source: Pennsylvania Department of Health.
Percent Change in Rural and Urban Hospital Emergency Room Visits, 2004-05 to 2014-15
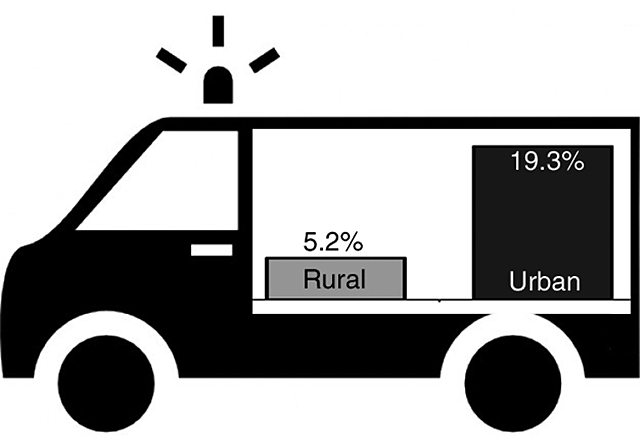
Data source: Pennsylvania Department of Health.
Number of Rural and Urban Health Care Providers per 100,000 Residents
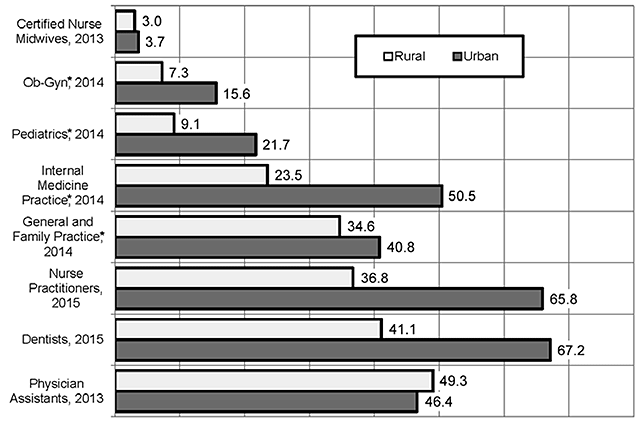
*Includes active, non-federal DOs and MDs that provide direct patient care. Data source: HRSA.
Number of Rural and Urban MDs Per 100,000 Residents, 1986, 1996, 2006, and 2014
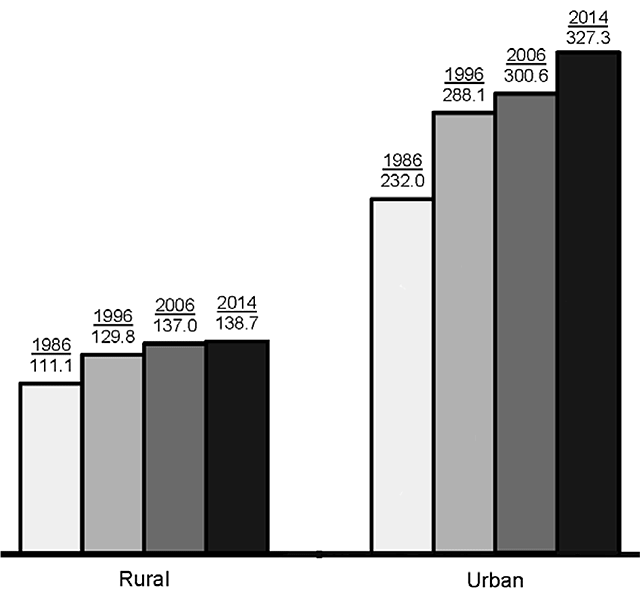
Data include non-federal MDs involved in patient care. Data source: HRSA.
From 1986 to 2014, the number of rural MDs increased 33 percent and the number of urban MDs increased 54 percent.
Health Professional Shortage Areas (HPSAs) and Medically Underserved Areas/Populations (MUAs) are designated by the U.S. Department of Health and Human Services Health Resources and Services Administration (HRSA).
HPSAs are areas that have shortages of primary medical care, dental or mental health providers and may be geographic (a county or service area), demographic (low-income population) or institutional (comprehensive health center, federally qualified health center or other public facility).
MUAs are areas or populations that have too few primary care providers, high infant mortality, high poverty and/or high elderly populations.
Pennsylvania's Health Professional Shortage Areas, 2016
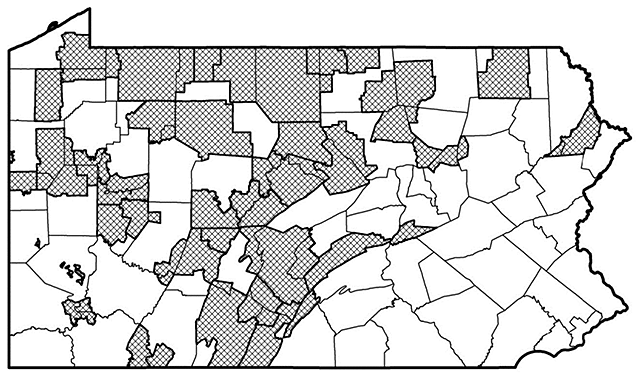
Data source: HRSA.
Pennsylvania's Medically Underserved Areas, 2016
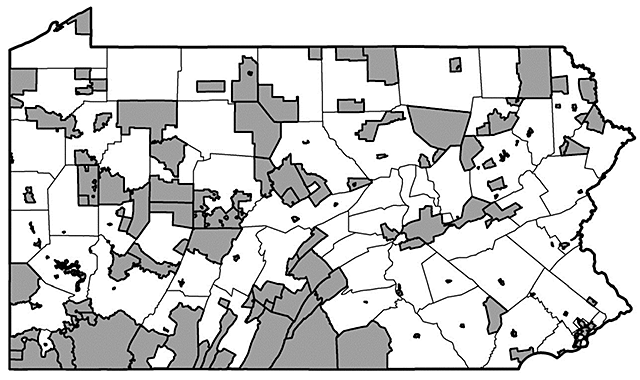
26 percent of rural Pennsylvanians and 2 percent of urban Pennsylvanians live in a Health Professional Shortage Area.
33 percent of rural Pennsylvanians and 16 percent of urban Pennsylvanians live in a Medically Underserved Area.
Data source: HRSA and U.S. Census Bureau.
Rural Manufacturing: Down But Not Out
Rural manufacturing jobs may have taken a hit over the past 15 years, but they certainly aren’t down for the count.
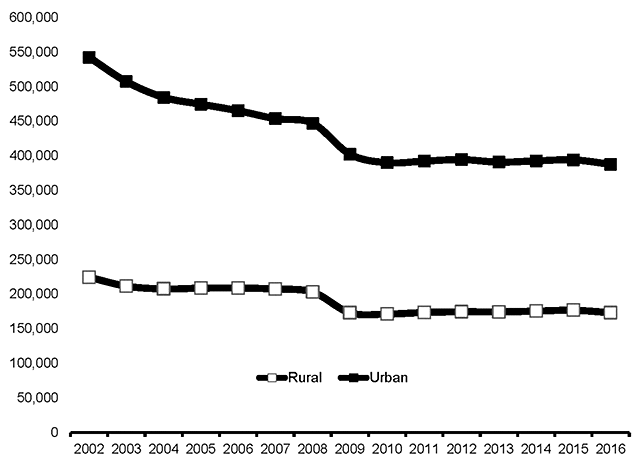
From 2002 to 2016, the number of rural manufacturing jobs decreased by more than 51,200, from 224,299 to 173,073. That’s according to yearly second quarter data from the Pennsylvania Department of Labor and Industry.
A closer examination of the data revealed that most rural manufacturing jobs were lost over one period but then stabilized over another period.
The first period was from 2002 to 2009, when the number of rural manufacturing jobs plummeted by 23 percent. Most of this loss was between 2008 and 2009, during the Great Recession, when 29,800 manufacturing jobs were eliminated.
During the second period, from 2009 to 2016, the number of jobs actually increased by 60.
This trend, however, does not apply to urban Pennsylvania manufacturing jobs. From 2002 to 2009, there was a 26 percent decline in the number of urban manufacturing jobs, and from 2009 to 2016, there was a 4 percent decline.
The nationwide trend in manufacturing jobs was somewhat similar to the rural Pennsylvania trend. According to data from the U.S. Bureau of Labor Statistics, manufacturing jobs in the U.S. declined 23 percent from 2002 to 2009, and then increased 5 percent from 2009 to 2016.
While the number of manufacturing jobs in rural and urban Pennsylvania and the U.S. are still below their historic highs, the manufacturing industry remains a vital economic sector. According to 2015 data from the U.S. Bureau of Economic Analysis, manufacturing contributes 12 percent, or $85 billion, to Pennsylvania’s Gross Domestic Product.
Manufacturing Sector Employment, Second Quarters, 2002 to 2016
Data source: Pennsylvania Department of Labor and Industry.
Fast Facts: Pennsylvania Farm Family Households
3.5 Average number of household members.
37 Percent of households with children (<18 years.)
69 Percent of married couple households (16 percent of households were single-person and 15 percent were households with other types of arrangements).
$69,688 Median household income (About 8 percent of households were in poverty).
34.8 Average age of individuals in a household (Among these individuals, 33 percent were under 18 years old, 53 percent were 18 to 64 years old, and 14 percent were 65 years old and older).
61 Percent of adults in the household who were employed (3 percent were unemployed, and 36 percent were not in the labor force. Among those who were employed, 27 percent worked in an ag-related industry).
Data source: 2015 American Community Survey, Public Use Microdata Sample (ACS-PUMS), U.S. Census Bureau. Data include all occupied single family homes and mobile homes on lots of one acre or more and have agricultural sales of $1,000 or more. The weighted sample included 31,233 households, or little more than one-half of Pennsylvania's nearly 59,300 farms.
Just the Facts: Rural Female Breadwinners
Among rural and urban married couples, women contributed 33 percent of income, on average, to total family income, according to data from the 2015 American Community Survey, Public Use Microdata Sample.
A closer examination of the data found that, among 24 percent of rural married couples and 26 percent of urban married couples, women contributed more than one-half (51+ percent) to their family’s total income. Here’s more on these “female breadwinners” and their families.
Female breadwinners are 53 years old, on average, and have median incomes of $44,757. Seventy-eight percent are employed and 37 percent have a bachelor’s degree or higher.
The men in rural female breadwinner families are 56 years old, on average, and have median incomes of $23,820. Fifty-four percent are employed and less than 20 percent have a bachelor’s degree or higher.
Rural female breadwinners are more likely to work in health care, education and retail, while their spouses are more likely to work in construction, manufacturing, and retail.
Fifty-five percent of female breadwinners have been married to their spouses for 20 or more years and 75 percent have been married only once.
Thirty-four percent of female breadwinner families have children under 18 years old living in their home. Additionally, 88 percent of these families live in their own home and 12 percent are renters.
Rural female breadwinner families have higher median incomes ($74,500) than rural male breadwinner families ($71,090).
Across the U.S., female breadwinner families make up 25 percent of married couple households. The three states with the highest percentage of female breadwinner families are Rhode Island, Delaware and Massachusetts, each with 27 percent or more. The three states with the lowest percentages of female breadwinner families are North Dakota, Wyoming and Utah, each with less than 19 percent. Pennsylvania has the nation’s 24th highest percentage of female breadwinner families (25 percent).
