Newsletters
- Home
- Publications
- Newsletter Archive
- Newsletter
March/April 2016
Inside This Issue:
- Study Projects Wealth Transfer of More than $300 Billion in Pennsylvania Over Next 10 Years
- Chairman's Message
- Rural Snapshot: Medicare Coverage for Seniors
- The Give and Take of Tax Season
- Rural Sites Needed for Summer Food Service Program
- Just the Facts: Vehicle Crashes and Cell Phone Use
Study Projects Wealth Transfer of More than $300 Billion in Pennsylvania Over Next 10 Years
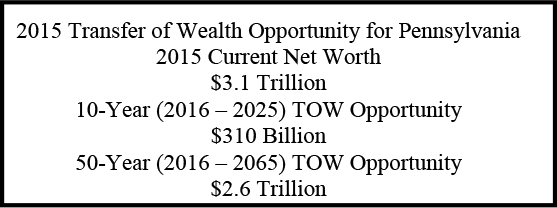
A study sponsored by the Center for Rural Pennsylvania projects $310 billion in personal wealth will be transferred from one Pennsylvania generation to another by 2025, with $2.6 trillion changing hands by 2065.
“This transfer of wealth provides all Pennsylvania communities with an extraordinary opportunity for charitable investments,” said Senator Gene Yaw, chairman of the Center for Rural Pennsylvania.
In 2008, the Center published the first transfer of wealth (TOW) analysis of Pennsylvania to spark conversations about the magnitude of the assets present in every county of the commonwealth and the opportunities to invest a small portion of those assets toward community betterment projects.
Since that first analysis, however, much has changed in the state and nation. This updated TOW study integrated those changes into its estimates, as well as historical trends and key assumptions about the future, to develop more current estimates for this intergenerational transfer of wealth. The study also updated the wealth scenarios for all 67 Pennsylvania counties.
“It is our hope that, with these updated estimates, residents will once again understand the power of their charitable giving, and will consider making a charitable investment now or through their wills to strengthen their community for generations to come,” Sen. Yaw said.
To understand the philanthropic potential associated with the commonwealth’s transfer of wealth opportunities over the next 10 years and next 50 years, consider that a 5 percent giving goal realized over the coming decade would yield $15.5 billion. A 5 percent giving goal realized over the next two generations would yield $130 billion.
“Giving is a personal decision. But there are many community members who take the future of their communities personally,” Sen. Yaw said. “Just think what could be achieved over the next 10 or 20 years if we include our community as one of our heirs.”
Background
The Center for Rural Entrepreneurship, a nonprofit organization based in Nebraska, conducted the first TOW analysis and the updated analysis. It developed a methodology for creating scenarios for inter-generational wealth transfer for the state and its counties, using conservative scenarios for the likely transfer of wealth from the base year of 2015 to 2065. The researchers considered 50 years of historical indicators starting with the post-World War II period and extending through 2015, the most recent year for which an adequate number of adjusted indicators necessary to establish current net worth are available, and projected estimates 50 years (to 2065) into the future, annually.
For the analysis, dollars were adjusted for inflation, so a dollar in 2065 would be worth the same as a dollar in 2015.
Making the transfer work for our communities
By tapping into some of the wealth that is projected to change hands over the next 10 to 50 years, Pennsylvania communities could take advantage of sustainable funding for community projects. “This is an opportunity to think about community investment in a new way,” said Barry Denk , Center director. “If communities can capture just 5 percent of this wealth, they can dramatically improve and sustain their communities’ quality of life for decades to come.”
Report, county scenarios available online
The report, Wealth Transfer in Pennsylvania 2016, and the 67 county scenarios are available at www.rural.palegislature.us.
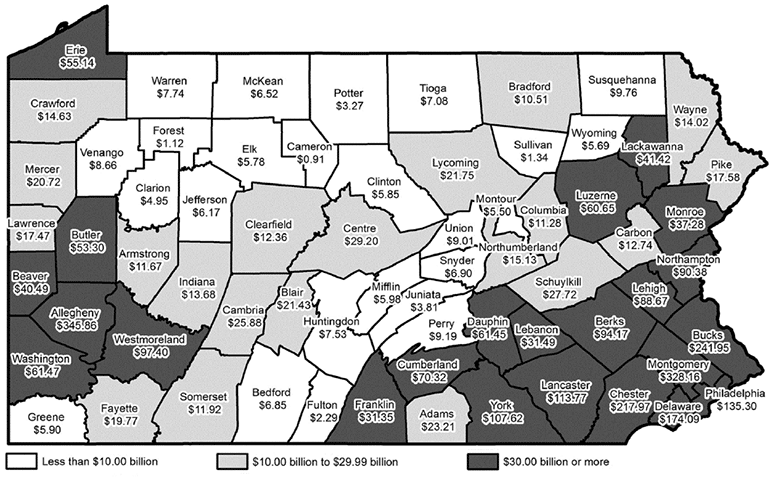
2015 Total Current Net Worth (in billions)
Chairman's Message
I’m sure that most people, at some point in time, have wished for a crystal ball to take a peek into the future. Knowing what to expect in the coming months or years ahead would certainly be a big help. And while we don’t have a crystal ball at the Center for Rural Pennsylvania, we do have math, which has helped us to formulate some reasonable assumptions about the future, specifically in terms of potential scenarios about the transfer of wealth from one generation to the next.
The Center’s recent transfer of wealth study updates the estimates from the first study, which was published by the Center in 2008. Both studies pointed to a significant transfer of wealth in Pennsylvania over the coming years. The current study estimates a transfer of about $310 billion from one generation to another, with rural counties experiencing a transfer of about $67.7 billion and urban counties experiencing a transfer of about $242 billion. Each of Pennsylvania’s 67 counties is estimated to realize a transfer of wealth, some in the hundreds of millions and some in the billions, which underscores some real philanthropic prospects for both rural and urban communities over the next 10 or even 50 years.
The transfer of wealth, or TOW, analysis offers two future scenarios of 10 and 50 years for every county, and provides an estimate of current net worth, as well. These scenarios are definitely worth reviewing, and can be found on the Center’s website.
I’m encouraged by the wealth scenario for my home county, and believe that every county scenario can be a real resource for philanthropic groups, community and economic development organizations, financial planners, agricultural interests, community residents and others working to enhance the quality of life in their county.
We appreciate the work of the Center for Rural Entrepreneurship for completing this TOW analysis, as well as the work of the many individuals who participated on the Technical Advisory Committee.
To learn more about the TOW analysis and the potential transfer of wealth from this generation to the next, I encourage you to review the report, Wealth Transfer in Pennsylvania 2016, which is available on the Center for Rural Pennsylvania’s website. It’s the closest thing to a crystal ball that we could muster.
Senator Gene Yaw
Rural Snapshot: Medicare Coverage for Seniors
This snapshot looks at rural and urban seniors, age 65 years old and older, who are enrolled in Medicare health plans that provide Part A and Part B benefits. The graph on PACE/PACENET, however, includes data for seniors who may be enrolled in other health plans as well as Medicare. Unless noted otherwise, data are from the Centers for Medicare and Medicaid Services Public Use File, State/County-All Beneficiaries.
Number of Rural and Urban Pennsylvania Senior Citizens (65+), 1970 to 2040 projected
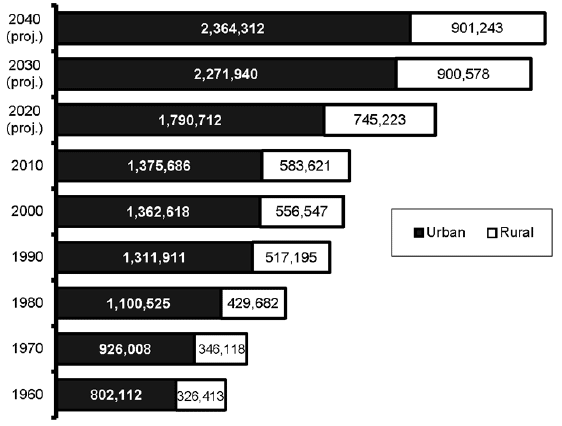
Data sources: decennial censuses, U.S. Census Bureau and the Pennsylvania State Data Center.
Percent of Total Population Enrolled in Medicare Part A and Part B, 2014
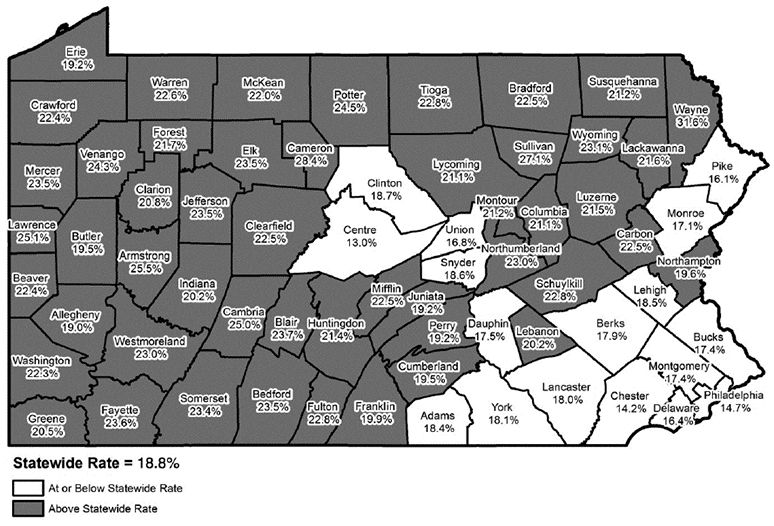
Data sources: Public Use File, State/County Report-All Beneficiaries, Centers for Medicare and Medicaid Services and 2014 Estimates, U.S. Census Bureau.
Medicare Costs per Beneficiary, Inflation Adjusted, 2007 to 2014
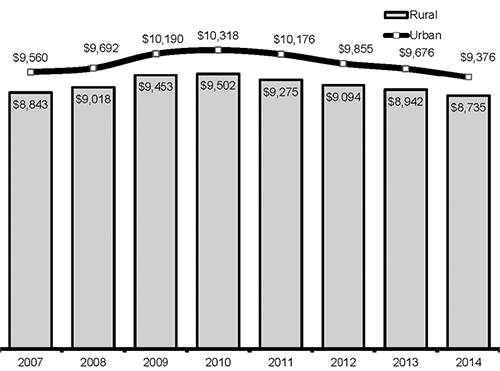
Figures adjusted for inflation using the CPI-U with 2014=100. Data included standardized Medicare costs.
Rural Medicare Costs, 2014 ($3.68 billion)
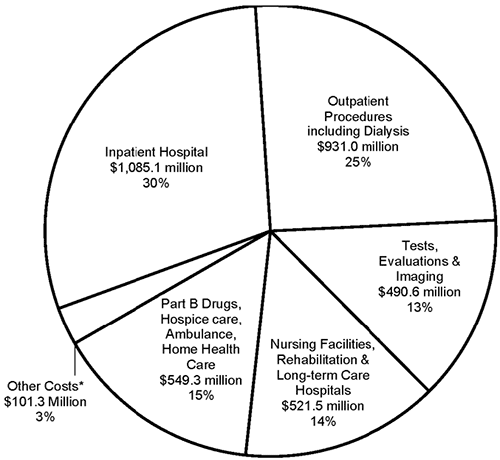
*Includes difference between the total standardized costs and the itemized standardized costs.
Urban Medicare Costs, 2014 ($8.86 billion)
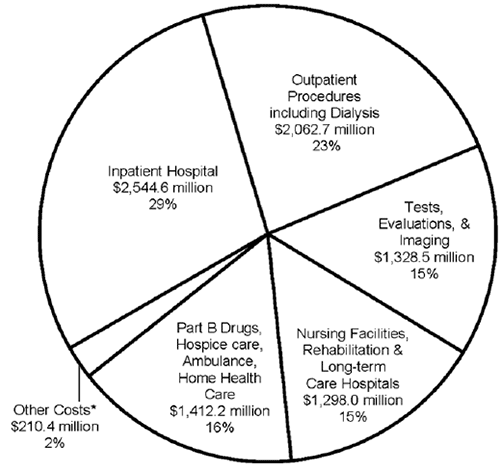
*Includes difference between the total standardized costs and the itemized standardized costs.
Types of Treatment Received by Medical Condition, Rural and Urban Medicare Beneficiaries, 2013
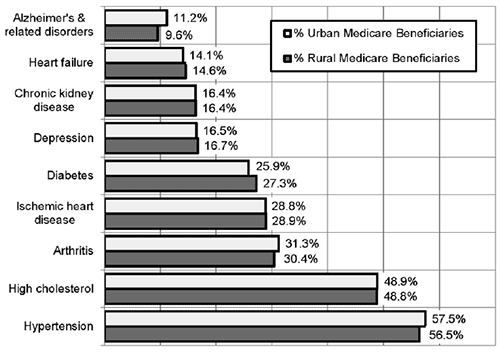
Percent of Rural and Urban Seniors (65+) Enrolled in Pennsylvania's PACE and PACENET Programs
The Give and Take of Tax Season
According to data from the Internal Revenue Service (IRS), the majority of rural tax filers get money back after filing their federal income taxes.
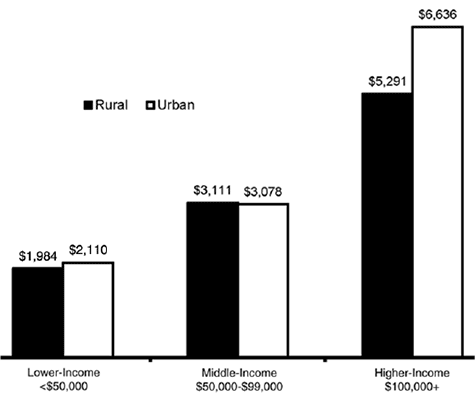
In 2013, 80 percent of rural filers received a federal tax refund. The average refund for rural Pennsylvanians was $2,524. Among urban filers, 78 percent received a refund and had an average refund of $2,860.
Not everyone, however, received a refund. In 2013, 14 percent of rural and 16 percent of urban filers owed money when they filed. The average amount owed was $4,120 among rural, and $5,141 among urban filers.
Rural and urban Pennsylvanians were not the only filers reaping a return. In 2013, 76 percent of filers across the U.S. received a federal refund, which was $3,025, on average, while about 18 percent owed money at the time of filing. The average amount owed in 2013 was about $5,207.
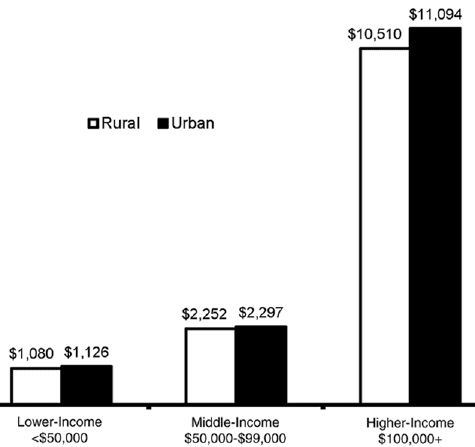
In Pennsylvania, there were differences in the amount of federal taxes owed among filers based on income. A closer analysis of lower-income (<$50,000), middle-income ($50,000 to $99,000), and higher-income ($100,000+) tax filers who owed taxes indicated that the highest percentage of filers who owed taxes were in the higher-income category. The higher-income group also owed more money, $10,988 on average, than the middle-income ($2,286 on average) and lower-income ($1,115 on average) groups.
These differences were apparent among rural and urban Pennsylvanians as well (see graphs below). Urban Pennsylvania tax filers tended to owe more money than rural Pennsylvania filers. For example, in 2013, 8 percent of rural low-income filers owed federal taxes at the time of filing, owing $1,080, on average. In comparison, the 9 percent of urban low-income tax filers who owed taxes at the time of filing owed $1,126, on average.
Average Amount of Federal Taxes Owed by Rural and Urban Pennsylvania Tax Filers, 2013
Average Amount of Federal Refund for Rural and Urban Pennsylvania Tax Filers, 2013
Data source: Internal Revenue Service, County Wide Data.
Rural Sites Needed for Summer Food Service Program
The Pennsylvania Department of Education (PDE) is encouraging rural nonprofit organizations to sponsor Summer Food Service Programs (SFSP) in their area. SFSP is a federally funded program that serves free meals to eligible children during the summer months. PDE administers the program, which is operated nationally by the U.S. Department of Agriculture. SFSP is a great resource available for local sponsors who want to combine a meals program with a summer activity program. Nonprofits that sponsor the SFSP receive reimbursement for qualifying meals served at approved SFSP sites. There is great need for SFSP sites, particularly in rural Pennsylvania, where many children are eligible for free and reduced price school meals.
For more information, visit PDE’s website at www.education.state.pa.us/SFSP.
Just the Facts: Vehicle Crashes and Cell Phone Use
In 2014, the Pennsylvania Department of Transportation (PennDOT) reported 976 vehicle crashes in Pennsylvania involving drivers using cell phones. Of these crashes, 24 percent were in rural counties and 76 percent were in urban counties. In both rural and urban counties, crashes involving cell phones accounted for 1 percent of all crashes.
From 2004 to 2014, crashes involving cell phones have declined. Rural counties saw a 6 percent decline and urban counties saw a 25 percent decline.
The rate of cell-phone-involved crashes in rural counties was 9.2 crashes for every 100,000 licensed drivers, and in urban counties, the rate was 11.7 for every 100,000 drivers.
In 2014, Allegheny, Montgomery and Philadelphia counties had the highest number of cell phone crashes, each with more than 70. Five counties, all rural, had no reported cell phone crashes: Cameron, Forest, Potter, Sullivan, and Venango.
According to data from the National Highway Traffic Safety Administration, there were 1,513 fatalities related to driver cell phone use from 2012 to 2014. The states with the highest number of fatalities were Tennessee, Texas and California, each with more than 130 fatalities. Hawaii, Alaska, Vermont and Rhode Island had the lowest number of fatalities, each with fewer than 3 deaths.
Pennsylvania had the nation’s 10th highest number of fatalities (37).
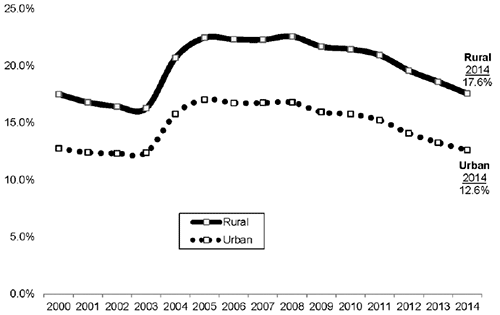
Number of Vehicle Crashes Involving Cell Phones per 100,000 Licensed Drivers
in Rural and Urban Pennsylvania, 2004 to 2014

Data source: Pennsylvania Department of Transportation.
