Newsletters
- Home
- Publications
- Newsletter Archive
- Newsletter
January/February 2017
Inside This Issue:
- Center Board Announces 2017 Research Grant Projects
- Chairman's Message
- Welcome
- Thank You
- Rural Snapshot: Men and Women in the Workforce
- Research Analyzes 2012 Ag Census Data
- Just the Facts: Unmarried Partner Households
- Fast Facts: Bridges
Center Board Announces 2017 Research Grant Projects
At its November 2016 meeting, the Center for Rural Pennsylvania’s Board of Directors approved four grant proposals and two mini grant proposals as part of the Center for Rural Pennsylvania’s 2017 Research Grant Program. The successful proposals cover a wide range of topics including medication-assisted treatment for opioid addiction, employment opportunities for adults with disabilities, historic preservation ordinances, and the cost-of-living in Pennsylvania.
The research grant projects will be conducted by faculty members from the Pennsylvania State University and the Pennsylvania State System of Higher Education universities.
“The Center for Rural Pennsylvania is continuing its important work, in collaboration with our university faculty partners, to investigate relevant issues to rural Pennsylvania and develop policy considerations for programs and other initiatives,” said Senator Gene Yaw, Center board chairman.
2017 Research Grant Projects
Availability of Medication-Assisted Treatment for Opioid Addiction in Rural and Urban Pennsylvania
Dr. Harry D. Holt of West Chester University of Pennsylvania will assess medication-assisted treatment (MAT) services in rural and urban Pennsylvania. He and his team of researchers will use GIS modeling to determine access to MAT services. They will also examine cost reimbursements and MAT expenses and provide policy considerations based on their findings.
An Economic Evaluation of the Pennsylvania State Forest System
Dr. Bing Ran of Pennsylvania State University€“Harrisburg will conduct an economic evaluation of the Pennsylvania state forest system. The study will include several research approaches, including a market-based economic benefits and impact analysis; a nonmarket valuation; an analysis of state forest management practices; and an analysis of the payments in-lieu-of-taxes system. Policy considerations based on the findings will also be presented.
Employment Opportunities for Rural Residents with Disabilities in Pennsylvania
Dr. Susan Boser of Indiana University of Pennsylvania will examine the opportunities and barriers to integrated employment for individuals with disabilities, options and challenges for community providers to address these barriers, and strategies other states are using. Policy considerations will also be presented.
Inventory and Analysis of Historic Preservation Ordinances in Pennsylvania
Dr. Steven Burg of Shippensburg University of Pennsylvania will create an inventory of municipal historic preservation ordinances in Pennsylvania along with the methods used by municipalities to protect historic resources. The research will evaluate current statutes to determine their impact on municipal historic preservation activities.
Comparing Rural and Urban Drug Use and Violence in the Pennsylvania Youth Survey
Dr. Jennifer Murphy of the Pennsylvania State University€“Berks will analyze the 2015 Pennsylvania Youth Survey to identify differences between rural and urban schools in substance use and violence. She also will be analyzing the data to identify trends and any school-specific programs that may have contributed to decreased rates of substance use and violence.
Analysis of Cost-of-Living Data for Pennsylvania Counties
Dr. Kenneth Louie or the Pennsylvania State University€“Erie will use data from the C2ER County Cost of Living (COL) Index to determine urban-rural cost-of-living differences and to identify and quantify the factors that determine each county’s COL. The researchers will provide information on why the COL is higher or rising faster in some Pennsylvania counties compared to others.
For more information about the Center’s Research Grant Program, visit www.rural.palegislature.us/grants_program.html.
Chairman's Message
Happy New Year! I hope you had a wonderful holiday season and are enthusiastically tackling all of your New Year resolutions.
As you can see from the article on Page 1, the Center’s 2017 Research Grant Program awards have been presented and faculty from the Pennsylvania State System of Higher Education universities and Penn State University are well on their way to starting their research projects.
The Center’s board and staff are also working hard to identify topics for the 2018 grant cycle. Our goal is to zero in on specific questions among a very broad range of issues that are important to our rural residents and communities. Our mandated subject areas for the grant program are rural people and communities, economic development, local government finance and administration, community services, natural resources and the environment, educational outreach, rural values and social change, agriculture, and health and welfare concerns.
With such a wide range of areas, you can understand how challenging it can be to get to the policy-relevant questions that may be answered through our research. We rely heavily on our board members, whose expertise and experience are extensive, to be our eyes and ears in our communities. Our board, with the help of staff, also reaches out to the legislature, educators, state and federal executive branch agencies, nonprofit organizations and others to identify the roots and branches of the issues and formulate pertinent questions that can be addressed through research. We said goodbye to several seasoned board members last year, and are happy to welcome our new members, Dr. Michael A. Driscoll of Indiana University of Pennsylvania and Dr. Timothy Kelsey of Penn State University, to help us continue our work.
Once the ideas for the next research round have been reviewed, and the board approves the targeted research topics, the Center will prepare and issue its formal 2018 Request for Proposals. While the Center’s grant program is only available to faculty at the Pennsylvania State System of Higher Education universities, Penn State University and the regional campuses of the University of Pittsburgh, we encourage cooperation and collaboration between these faculty and other public or private organizations. Look for the Request for Proposals to be posted online in March.
As the year progresses, we’ll continue to share the results of our research, and of course information from our database on rural Pennsylvania, with you.
Senator Gene Yaw
Welcome
The Center welcomes Dr. Michael A. Driscoll, president of Indiana University of Pennsylvania (IUP), and Dr. Timothy Kelsey, professor of agricultural economics at Pennsylvania State University, to the board.
Dr. Driscoll joined IUP in 2012. In his tenure, he has focused on diversity and inclusion issues, improving the university experience for military-affiliated students and their families, and strengthening IUP’s relationship with the local community. Previously, he served as the executive vice chancellor and provost of the University of Alaska Anchorage. He earned his Ph.D., MS and BS in electrical engineering at Michigan State University.
Dr. Kelsey has been at Penn State since 1991. He currently teaches courses on community-based research methodologies, economic development tools, and community development. He received his Masters and Ph.D. in agricultural economics from Michigan State University.
 Dr. Driscoll |
 Dr. Kelsey |
Thank You
At its November meeting, the Center board thanked departing members (from left) Dr. Ted Alter, Dr. Karen Whitney, Sen. John Wozniak and Taylor Doebler (not pictured) for their service to the board and their work on behalf of rural Pennsylvania.
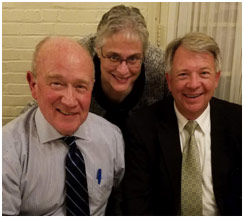
Left to right: Dr. Ted Alter, Dr. Karen Whitney and Sen. John Wozniak.
Rural Snapshot: Men and Women in the Workforce
Male Employment Rate, 1980 to 2015
Civilian employed males as percent of all males 16+ years old
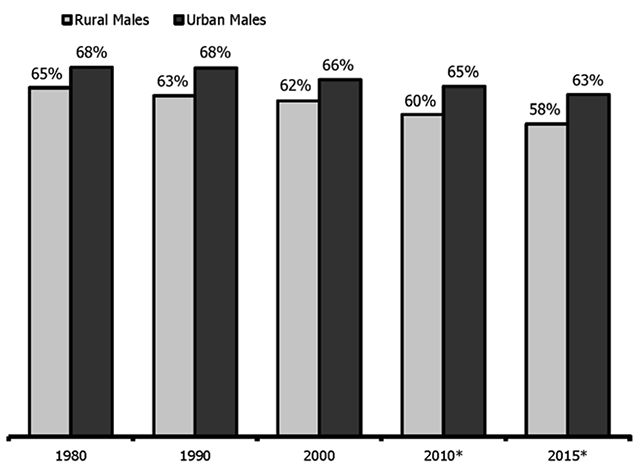
*Data represent a 5-year average. Data sources: 1980, 1990 and 2000 Censuses, the 2010 5-year Average and the 2015 5-year Average, American Community Survey, U.S. Census Bureau.
Rural and Urban Male Labor Force Participation Rates, 2015
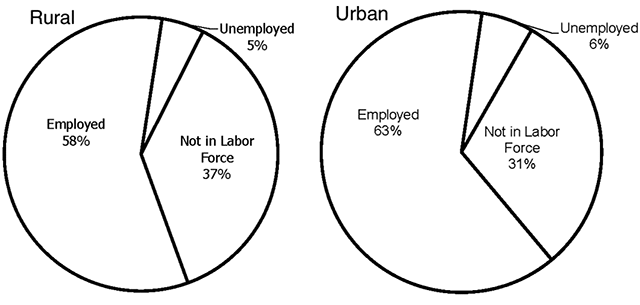
Data source: 2015 5-year Average, American Community Survey, U.S. Census Bureau.
Median Earnings of Rural and Urban Males, 2015
Includes only males 18 years old and older who work full-time and year-round
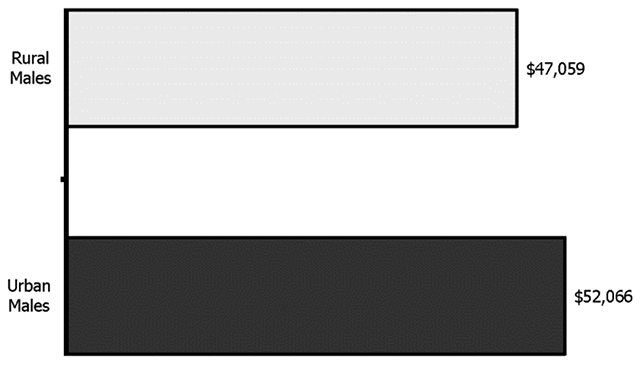
Data source: 2015 American Community Survey, Public Use Microdata Sample, U.S. Census Bureau.
Rural and Urban Males in the Workforce, 2015

Data include those aged 18 years and older who are employed. Data source: 2015 American Community Survey, Public Use Microdata Sample, U.S. Census Bureau.
Female Employment Rate, 1980 to 2015
Civilian employed females as percent of all females 16+ years old
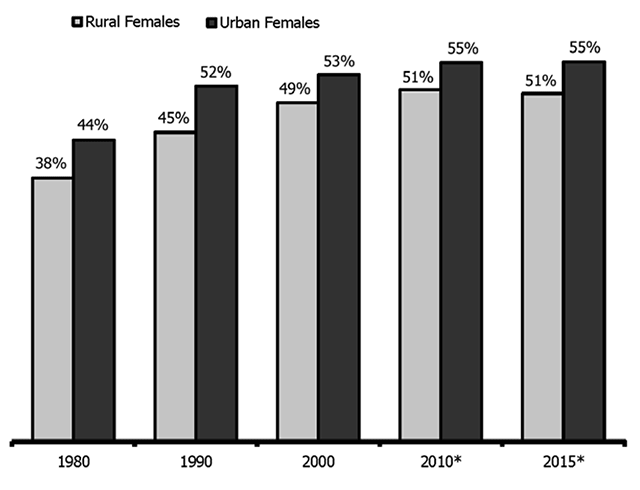
*Data represent a 5-year average. Data sources: 1980, 1990 and 2000 Censuses, the 2010 5-year Average and the 2015 5-year Average, American Community Survey, U.S. Census Bureau.
Rural and Urban Female
Labor Force Participation Rates, 2015
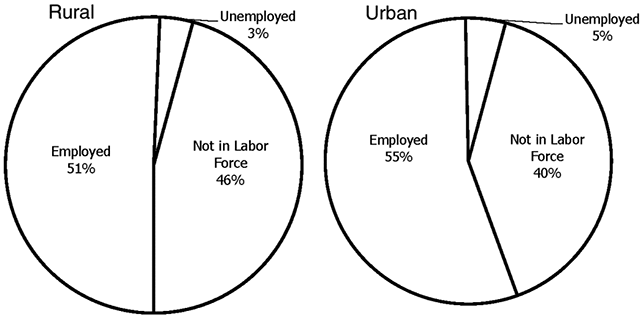
Data source: 2015 5-year Average, American Community Survey, U.S. Census Bureau.
Median Earnings of Rural and Urban Females, 2015
Includes only females 18 years old and older who worked full-time and year-round
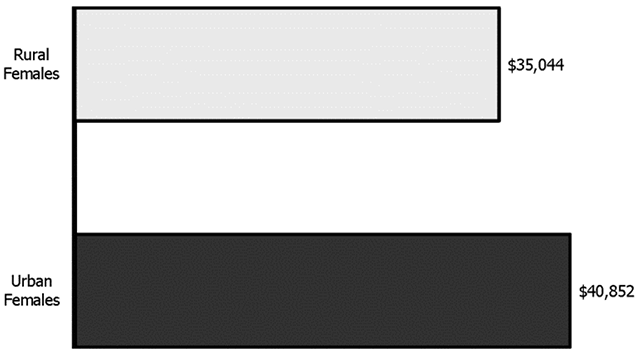
Data source: 2015 American Community Survey, Public Use Microdata Sample, U.S. Census Bureau.
Rural and Urban Females in the Workforce, 2015

Data include those aged 18 years and older who are employed. Data source: 2015 American Community Survey, Public Use Microdata Sample, U.S. Census Bureau.
Research Analyzes 2012 Ag Census Data
From 2007 to 2012, there was a decline in the number of farms (6 percent) and acres of farmland (1 percent) in Pennsylvania and an increase (5 percent) in average farm size, according to research conducted by Dr. Sunita Mondal and Dr. Roger Solano of Slippery Rock University of Pennsylvania.
The study also found that a majority of Pennsylvania farms were medium-sized, ranging between 50 and 179 acres, and were mostly family owned or individual proprietorships (88 percent). Pennsylvania farms sold nearly $5.8 billion, adjusted for inflation, in agricultural products in 2012, up 15 percent from 2007.
The research, sponsored by the Center for Rural Pennsylvania, used data from the 2002, 2007 and 2012 U.S. Censuses of Agriculture to provide a comprehensive analysis of Pennsylvania farmers, the types of farm operations in Pennsylvania, and existing trends and conditions in the state’s agriculture industry. The Ag Census is conducted every 5 years by the U.S. Department of Agriculture’s National Agricultural Statistics Service (NASS) to collect information on land use and ownership, operator characteristics, production practices, income and expenditures.
The research found that male farmers reported the greatest share of agricultural sales (96 percent). In more recent years, female farmers reported higher sales increases, with the value of crops sold increasing 93 percent from 2007 to 2012. This result is promising since female farmers comprise about 14 percent of the total number of farmers in the state. The proportion of minority farmers in the state remained very low (1 percent), and has remained unchanged from 2002 to 2012.
The average age of Pennsylvania farmers is increasing. In 2012, the average age of farmers was 56 years old, a year older when compared to 2007. Fifty-two percent of Pennsylvania farmers reported farming as their primary occupation. Out of these, 17 percent were over age 65, and less than 1 percent was under age 25. This, coupled with a 30 percent decline in the number of farmers in the 45-49 age group, further indicated higher average ages of farmers. While this trend is similar nationwide, Pennsylvania farmers are younger, on average, when compared to the nation as a whole.
In Pennsylvania, net cash farm income increased with farm size, with larger farms (500 plus acres) representing 32 percent of the total farm income in 2012. Net farm income among smaller farms (1-49 acres) decreased significantly (38 percent) between 2002 and 2012.
A majority of farms in Pennsylvania (52 percent) sold less than $10,000 of agricultural products in 2012, and about 21 percent sold between $10,000 and $50,000. , and 20 percent sold $100,000 or more. Across the U.S., 57 percent of farms sold less than , and 18 percent sold $100,000 or more.
Farm labor totaled 65,487 workers in 2012, up 8 percent since 2007. Starting in 2012, the Census reported the number of migrant farm workers: 440 farms reported a total of 4,268 migrant workers.
Among the different sizes of farms, labor employment increased significantly for farms of 1 to 49 acres, with a 13 percent increase in the number of workers between 2007 and 2012. There was a 14 percent increase in farm labor employment for farms of 50 to 179 acres. On the other hand, labor employment at farms of 180 to 499 acres declined 1 percent.
The research also compared Pennsylvania with Delaware, Maryland, New Jersey, New York, Ohio, West Virginia and the U.S. as a whole in terms of farming as an occupation. In 2012, 52 percent of operators in Pennsylvania reported farming as their primary occupation, which was higher than the national average (48 percent), and lower than Delaware (64 percent) and New York (57 percent). Nationwide, there was a 10 percent decline in the proportion of operators with farming as their primary occupation between 2002 and 2012. In Pennsylvania, there was a 5 percent decline between 2002 and 2012. Ohio witnessed the highest decline of about 12 percent.
For a copy of the research results, Analysis of 2012 Census of Agriculture Data, visit the Center’s website at www.rural.palegislature.us.
Just the Facts: Unmarried Partner Households
Data from the 2015 American Community Survey, Public Use Microdata Sample show that, in both rural and urban Pennsylvania, unmarried partner households comprised 7 percent of all households.
According to the Census Bureau, unmarried partner households are households where the partners are not married but have a close and personal relationship that goes beyond sharing household expenses. Unmarried partner households can be opposite-sex couple households or same-sex couple households.
Ninety-six percent of rural unmarried partner households were opposite-sex partners and 4 percent were same-sex partners. In urban areas, 94 percent were opposite-sex partners and 6 percent were same-sex partners.
On average, rural unmarried partner households had 2.9 persons and 41 percent of these households had children (persons under 18 years old). On average, urban unmarried partner households had 3.0 persons and 39 percent had children.
In rural and urban areas, the average age of unmarried partners was 39.6 and 39.3, respectively. Ninety-six percent of rural unmarried partners were white and 4 percent were non-white. Seventy-six percent of urban unmarried partners were white and 24 percent were non-white.
Approximately 18 percent of rural unmarried partners and 28 percent of urban unmarried partners have a bachelor’s degree or higher.
Fifty-seven percent of rural unmarried partners and 67 percent of urban unmarried partners have never been married.
In 2015, the median household income for rural unmarried partner households was $59,075 and for urban unmarried partner households it was $65,883. Twenty-three percent of rural and 20 percent of urban unmarried partner households had incomes below the poverty level.
Among rural unmarried partners, 74 percent were employed, 6 percent were unemployed, and 20 percent were not in the labor force. Among urban unmarried partners, 77 percent were employed, 6 percent were unemployed, and 17 percent were not in the labor force.
The majority (53 percent) of rural unmarried partners lived in their own home and 47 percent were renters. Among urban unmarried partners, 52 percent were renters and 48 percent were homeowners.
Among unmarried partners that rented their home, 14 percent of rural households and 13 percent of urban households paid more than one-half of their income for rent.
Fast Facts: Bridges
12,611 Number of bridges located in rural counties.
56 Percent of all Pennsylvania bridges located in rural counties.
115 Number of rural bridges that are either on the National Register of Historic Places or eligible for the National Register.
1,306 Number of rural bridges that are one-lane for two-way traffic.
4,523 Number of rural bridges with a "Good" to "Excellent" superstructure rating.
1,828 Number of rural bridges with a "Poor" to "Critical" superstructure rating.
Data source: 2015 National Bridge Inventory, Federal Highway Administration.
