Newsletters
- Home
- Publications
- Newsletter Archive
- Newsletter
November/December 2015
Inside This Issue:
- Research Finds Unearned Income Making Up Larger Share of Personal Income in Rural Pennsylvania
- Chairman's Message
- Center Chairman Receives Rural Health Award
- Rural Snapshot €“ Rural Residents on the Move: In- and Out-Migration
- Slight Increase in Rural Public Transportation Use
- Rural and Urban Top Employer Categories
- Quick Facts on Pennsylvania's Population
- Just the Facts: Pennsylvania Dams
Research Finds Unearned Income Making Up Larger Share of Personal Income in Rural Pennsylvania
Research analyzing personal income in rural and urban Pennsylvania found that per capita personal income increased from $3,931 to $37,256 in rural counties from 1972 to 2012 and from $4,948 to $47,991 in urban counties during the same four decades.
The research also found that unearned income became a larger percentage of personal income in rural Pennsylvania from 2002 to 2012 €“ not because rural county residents received more government transfer payments than urban counties, but because rural net earnings have lagged behind urban earnings.
Todd Behr, Dr. Constantinos Christofides, and Dr. Pattabiraman Neelakantan of East Stroudsburg University of Pennsylvania conducted the research, which was sponsored by the Center for Rural Pennsylvania.
The research was completed in 2015 and analyzed the growth of unearned income in rural and urban Pennsylvania counties from 2002 to 2012. It also examined unearned income in rural and urban Pennsylvania, Pennsylvania as a whole, and the U.S. over a 40-year period to compare long€“term trends in personal income.
Net Earnings Per Capita 2012*
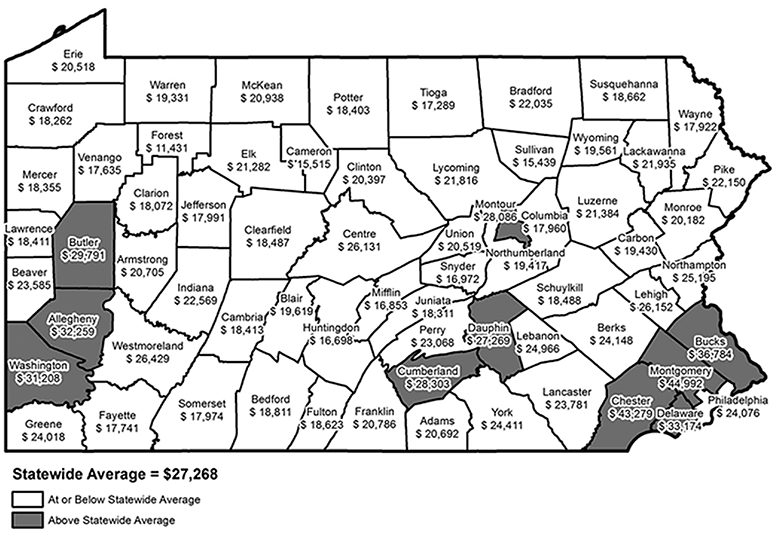
Source: BEA Economic Profiles CA30. *Data adjusted for inflation with 2009=100.
Data Sources and Definitions
The researchers used data from the U.S. Department of Commerce’s Bureau of Economic Analysis, the U.S. Bureau of Labor Statistics, the Pennsylvania Department of Labor and Industry, the U.S. Census Bureau, and the Pennsylvania Department of Environmental Protection.
They used the Social Security Administration Handbook to define unearned and earned income as follows:
Unearned income is all income not earned, including: in-kind support and maintenance (food or shelter) given to an individual or received by an individual; private pensions and annuities; periodic public payments such as Social Security benefits, Railroad Retirement benefits, Department of Veterans Affairs pension and compensation payments, civil service annuities, workers' compensation, unemployment compensation, and payments based on need involving federal funds; life insurance proceeds and other death benefits; gifts and inheritances; support and alimony payments; prizes and awards; dividends and interest; rents and royalties (except those royalties defined as earned income); and certain payments not considered wages for Social Security purposes such as in-kind payments to certain agricultural workers, tips under $20 per month, and jury fees.
Earned income includes: wages paid for services performed by employees; military pay; net earnings from self-employment; payments for participating in workshops; sickness or temporary disability payments; and certain royalties and honorariums (such as royalty payments to an individual in connection with any publication of the work of the individual or if an individual receives a royalty as part of his/her trade or business).
Results
Urban counties had significantly higher net earnings than rural counties. These earnings also surpassed the national average net earnings.
The research also found that rural Pennsylvania counties received significantly lower income maintenance payments and lower levels of retirement benefits than urban counties. Income maintenance payments consist of supplemental security income payments, family assistance, food stamps and other assistance payments.
While rural counties received lower levels of transfer payments, they became increasingly dependent on these same payments. This was due to slower growth of earned income in rural counties.
In general, the research found that, over the 40-year period of 1972 to 2012, rural counties in Pennsylvania had lower levels of per capita earned income and lower unearned income per capita than urban counties.
Research available
For a copy of the research, Analysis of Unearned Income in Rural and Urban Pennsylvania, visit www.rural.palegislature.us.
Chairman's Message
Packing up the moving van and driving it out of your hometown, or even your home state, is a common experience for many people. As a father of two grown children, I’m very familiar with the moving process and all of the happiness and headaches that usually come along for the ride. During the most recent drive to help my youngest move to her new home, I was reminded of the population projections released by the Center for Rural Pennsylvania in March 2014, especially the information about in- and out-migration.
According to those projections, Pennsylvania’s rural population is estimated to increase about 4 percent, or by 146,914 people, from 2010 to 2040. The projections estimated that Pennsylvania’s urban population would increase by 1.27 million people, or 14 percent, from 2010 to 2040.
Overall, the projections indicate in-migration will play a larger role in spurring population growth in the years ahead. For example, of the total number of people who are estimated to migrate to rural Pennsylvania, 56 percent are likely to be from other countries and 44 percent are likely to be from urban Pennsylvania counties or other states.
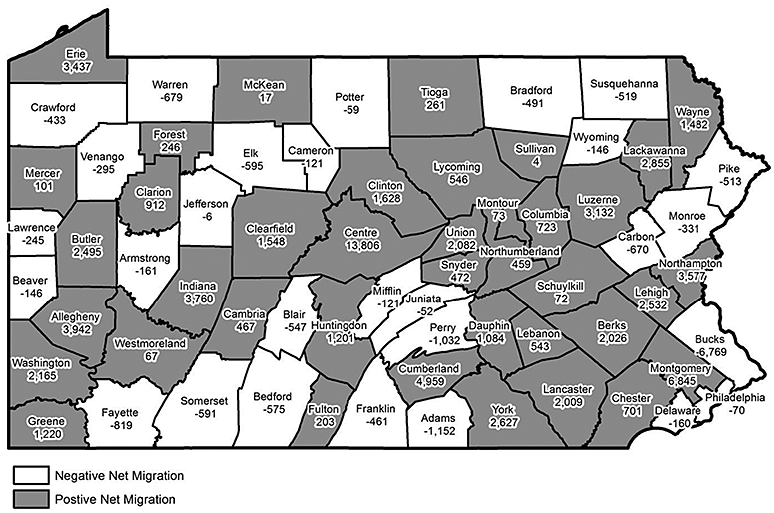
For a more recent look at the migration patterns of our rural residents, turn to the Rural Snapshot on Pages 4 and 5. The information in this installment shows that our rural residents, for the most part, aren’t crossing the Mississippi River to get to or move from rural Pennsylvania, but are keeping close to the East Coast. It also shows that much of rural Pennsylvania has been experiencing positive net migration.
It will be interesting to see how these tables and graphs shift and change over the coming years. And you can be sure that the Center will share those changes with you.
As we look forward to 2016, the Center will continue to track the trends, conditions and opportunities for our rural communities and our commonwealth, as a whole, and provide you with timely research and data. And as always, I encourage you to contact the Center with any data needs or research ideas.
On behalf of the board and staff, I wish you a happy holiday season and safe traveling.
Senator Gene Yaw
Center Chairman Receives Rural Health Award
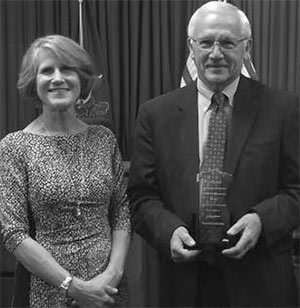
Lisa Davis, PORH director, and Sen. Yaw.
Congratulations to Sen. Gene Yaw, Center board chairman, on receiving the 2015 Legislator of the Year Award from the Pennsylvania Office of Rural Health (PORH). In late October, Lisa Davis, PORH director, presented the award to Sen. Yaw to recognize the substantial contribution he has made to rural health in Pennsylvania in his role as the Center chairman, and especially his role in helping to organize and host a series of public hearings in 2014 and 2015 on the heroin epidemic facing Pennsylvania.
“I was shocked and very surprised, as it was something I never expected,” Yaw said. “When we started the heroin hearings a year ago, the goal was to raise the awareness of the heroin problem in rural Pennsylvania. As a result of those hearings, the Center for Rural Pennsylvania has completed the most definitive report on the heroin problem in the state. The fact that the work of the Center has led to this award is very rewarding to me.”
Rural Snapshot €“ Rural Residents on the Move: In- and Out-Migration
(Note: All data are from the 2009-13 American Community Survey, U.S. Census Bureau unless otherwise cited.)
Estimated Net Domestic and International In-Migration to Rural Pennsylvania, 1990-91 to 2013-14
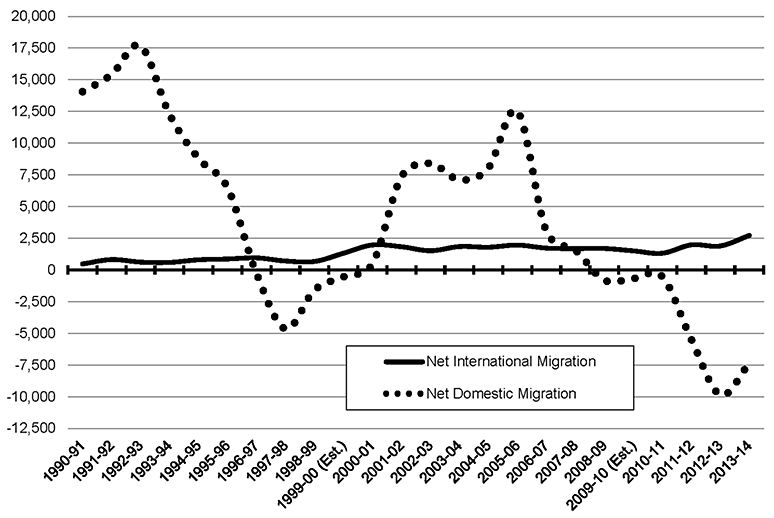
Data source: Population Estimates, U.S. Census Bureau.
Net Migration by County, 2009-13
Profile of Adults Who Moved Into and Out of Rural Pennsylvania, 2013*
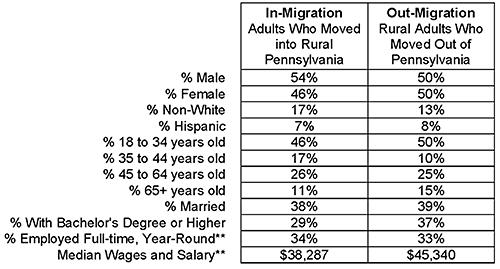
*Includes non-institutionalized people 18 years old and older not enrolled in school for the past 3 months. **Data include those who are employed full-time (35+ hours a week) and year round (50+ weeks are year) and who worked in the preceding week. Data source: 2013 American Community Survey, Public Use Microdata Sample, U.S. Census Bureau.
In-Migration to Rural Pennsylvania, 2009-13
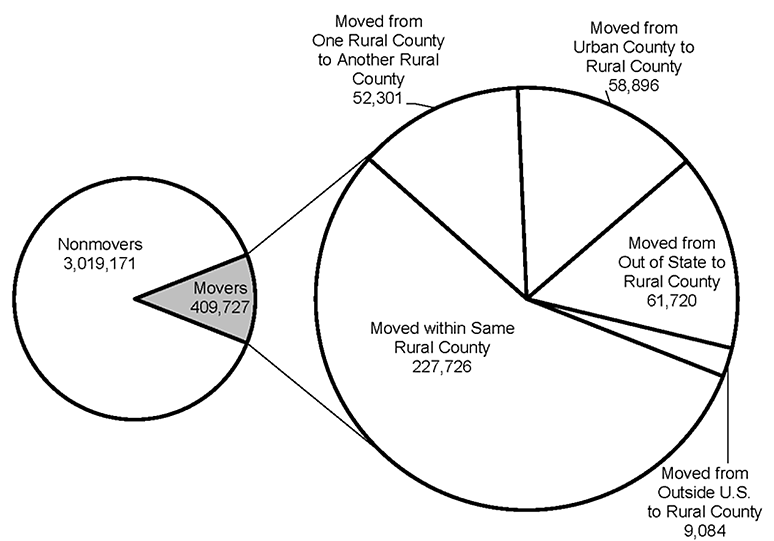
Out-Migration from Rural Pennsylvania, 2009-13
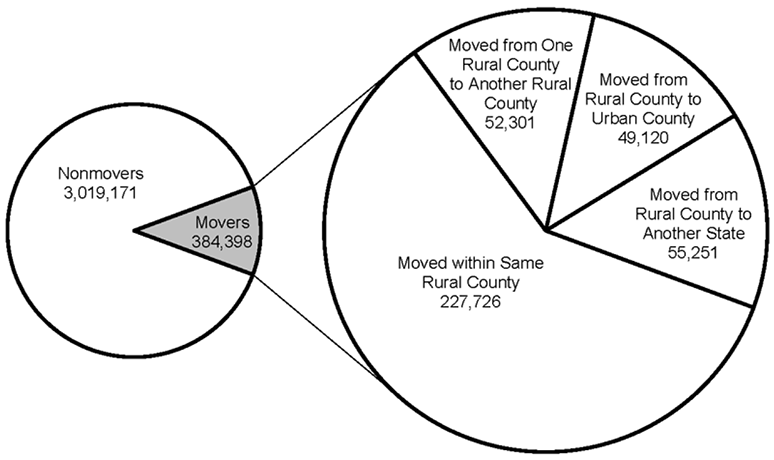
Out-Migration from Rural Pennsylvania to Other Counties in Pennsylvania and Nationwide, 2009-13
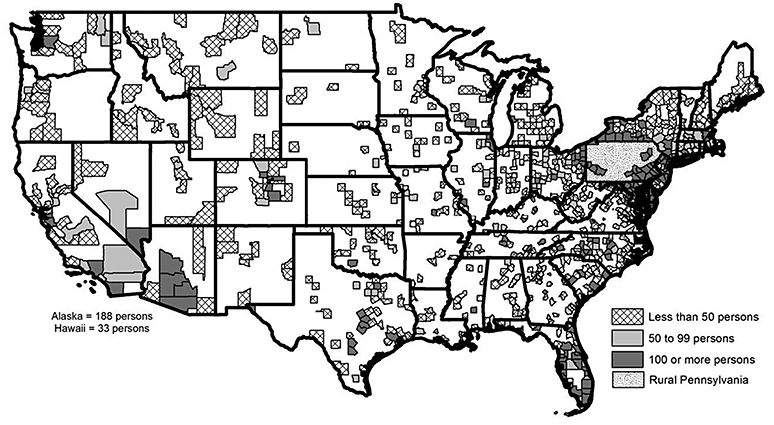

Slight Increase in Rural Public Transportation Use
For the majority of rural Pennsylvanians, driving solo in a car or truck for about 25 minutes is how they start their workday. According to data from the U.S. Census Bureau, in 2009-13, 84 percent of rural Pennsylvanians not working at home drove alone to work.
There are, however, a small but growing number of rural commuters who use public transportation to get to work.
In 2009-13, about 1 percent, or 13,700, rural workers used public transportation to get to and from work. From 2000 to 2009-13, the number of rural commuters using public transportation increased 21 percent. During this same period, the number of urban commuters using public transportation increased 10 percent. Nationwide, there was a 19 percent increase.
Following are some basic characteristics of rural commuters using public transportation, according to data from the 2013 American Community Survey, Public Use Microdata Sample:
- 56 percent are female and 44 percent are male;
- 17 percent are employed in education, 16 percent in the restaurant and entertainment sector, and 12 percent in professional services;
- 57 percent work full-time (35 or more hours per week) and 43 percent work part-time (less than 35 hours per week);
- 70 percent work for for-profit companies; 11 percent work for nonprofits; 14 percent work for government agencies; and 5 percent are self-employed;
- 35 percent have a bachelor’s degree or higher;
- 23 percent are foreign born and 77 percent are native born; and
- $20,151 are their median earnings.
Rural and Urban Top Employer Categories
According to 2014 fourth quarter data from the Center for Workforce Information and Analysis, the five largest categories of employers in rural Pennsylvania counties were: health care (22 percent): manufacturing (19 percent); state and federal governments (15 percent); school districts (15 percent); and sales/retail (9 percent).
Among urban counties, the five largest categories were: health care (31 percent); state and federal government (15 percent); sales/retail (13 percent); county government (12 percent); and manufacturing (10 percent).
Rural counties with health care as their top employer category had more business establishments per capita, and higher weekly wages than rural counties with other categories as their top employer.
Urban counties with health care as the top employer category had higher numbers of businesses per capita, and lower unemployment rates, but lower weekly wages than urban counties with other top employers.
Rural counties with manufacturing as the top employer category had lower unemployment rates, but lower weekly wages.
Urban counties with manufacturing as the top employer category had more businesses per capita, higher weekly wages, and lower unemployment rates.
Quick Facts on Pennsylvania's Population
-0.8 Percent change in Pennsylvania's rural estimated population from 2010 to 2014.
1.2 Percent change in Pennsylvania's urban estimated population from 2010 to 2014.
10,871 Net change in international migration into rural Pennsylvania from 2010 to 2014.
-24,681 Net change in domestic migration into rural Pennsylvania from 2010 to 2014.
Just the Facts: Pennsylvania Dams
According to data from the U.S. Army Corps of Engineers, there are 1,552 dams in Pennsylvania’s rural and urban counties. They range in age from relatively new (completed in 2010) to historic, with some more than two centuries old (completed in 1748). Dams across Pennsylvania differ not only in age, but also height, primary purpose, ownership, length, depth, and type.
Dam height statewide ranges from 3.5 feet (Delaware County) to 410 feet (Allegheny County). Dams in rural counties tend to be slightly higher than those in urban counties, with rural dams averaging 35 feet, and urban dams averaging 31 feet.
Storage size of all dams is measured in acre-feet, which is one acre of surface water to a depth of one foot. In rural Pennsylvania counties, the average storage size of dams is 8,733 acre-feet, and, in urban counties, that number is almost cut in half, with an average storage size of 4,349 acre-feet.
Most dams in Pennsylvania are privately owned (62 percent), and used for recreation (52 percent). In rural counties, 65 percent of dams are privately owned and in urban counties, 56 percent are privately owned. Local governments own a higher percentage of dams in urban counties (29 percent) than in rural counties (20 percent).
In rural counties, 56 percent of dams are primarily used for recreation, while 43 percent of urban county dams are used for recreation.
A higher percentage of dams in urban counties are primarily used for flood control purposes (22 percent) than in rural counties (10 percent). Urban counties also have a higher percentage of dams for water supply purposes (18 percent) than rural counties (15 percent).
Nationwide, Texas has the most dams, with 7,310, followed by Kansas (6,374), and Georgia (5,132).
