Newsletters
- Home
- Publications
- Newsletter Archive
- Newsletter
November/December 2014
Inside This Issue:
- Center Releases Report from Heroin Public Hearings
- Chairman's Message
- Municipal Expenditures for Volunteer Fire Services
- Rural Snapshot: Rural Youth Education Project €“ Should I Stay Or Should I Go?
- On the Trail of Pennsylvania's Limited Wineries
- Did You Know . . .
- Just the Facts: Super Commuters
Legislation addressing heroin, opioid abuse enacted
Center Releases Report from Heroin Public Hearings
Two pieces of legislation, supported by many of the law enforcement, judiciary, health care and treatment professionals who testified at the Center for Rural Pennsylvania’s public hearings on heroin and opioid addiction, are now law. The Pennsylvania General Assembly passed Senate Bill 1164 on September 24 and Senate Bill 1180 on October 20, both of which were later signed by Governor Tom Corbett.
Senate Bill 1164, now Act 139, provides legal protections for witnesses, or Good Samaritans, seeking medical help at the scene of an overdose. In addition, it allows Naloxone, a synthetic drug that blocks opiate receptors in the nervous system, to be prescribed to a third party, such as a friend or family member, and administered by law enforcement and firefighters.
Senate Bill 1180, now Act 191, expands the types of drugs monitored under the state’s existing Prescription Drug Monitoring Program to include Schedule II through V controlled substances. It also creates a board within the Department of Health to establish and oversee an electronic data system listing all controlled substances that are prescribed and dispensed in Pennsylvania.
These pieces of legislation, along with other items for consideration, were highlighted in the Center’s report, Heroin: Combating this Growing Epidemic in Pennsylvania, which was released on September 23. The report summarized the findings of four statewide hearings in July and August on heroin and opioid related deaths and arrests across Pennsylvania.
Presenters at the hearings, who included not only law enforcement officials, judges, and health care and treatment providers but also educators and parents who lost children to heroin and other opioid overdoses, identified these pieces of legislation and additional items for consideration that focused on education and prevention, law enforcement, and treatment.
Center Board Chairman Senator Gene Yaw, Vice Chairman Senator John Wozniak, and Board Member Dr. Karen Whitney each hosted a public hearing in Williamsport, Loretto and Clarion, respectively. Senator Judy Schwank hosted a hearing in Reading. Center board members and other legislators from across the state presided over the hearings, which together garnered about 20 hours of testimony.
After the release of the report, Senator Yaw said: “Heroin use is a statewide and national epidemic impacting residents of every age, race, gender and socioeconomic background. While the hearings and legislation have helped to highlight and address some issues related to heroin and opioid abuse, we, as a state, must continue to do more.”
The report is available at http://www.rural.palegislature.us/documents/reports/heroin_report2014.pdf.

Center Board Chairman Sen. Gene Yaw (at podium), accompanied by Board Vice Chairman Sen. John Wozniak, Board Treasurer Rep. Garth Everett,
Board Member Rep. Rick Mirabito, and Director Barry Denk, announces the release of the report, Heroin: Combating this Growing Epidemic in Pennsylvania, at a press conference at the Capitol Building on September 23.
Chairman's Message
It’s been an interesting and eventful year at the Center. From the release of our population projections early in the year to the release of our report on Pennsylvania’s heroin epidemic in late September, the Center has been meeting and working with a wide range of organizations, agencies, communities and individuals to learn, to engage, and to inform.
Oftentimes, the Center’s work follows a process and a pattern. Take for example, the population projections. These were compiled as part of our yearly Research Grants Program. That process starts early in the year as the board identifies topics or issues that need further analysis or even some basic data gathering. Faculty from Penn State University, the State System of Higher Education universities and the regional campuses of the University of Pittsburgh submit their Letters of Intent for consideration to the board. Faculty whose Letters of Intent are approved by the board then submit their full research proposals by late summer. In December, the board reviews these research proposals and makes its decision on which proposals to accept for the upcoming year. As always, those research awards are announced at the beginning of the New Year, and shortly thereafter, the grant process begins all over again.
Sometimes, though, the Center is tapped to gather and deliver information on more immediate needs. This was the case with the public hearings on heroin that the Center conducted in July and August. The information gathered from those hearings was summarized in the report, Heroin: Combating this Growing Epidemic in Pennsylvania, which is available on the Center’s website. Other examples of actions taken by the Center to address pressing issues include testimony and data staff presented to the Senate Banking and Insurance and Environmental Resources and Energy Committees in January regarding the Biggert-Waters Flood Insurance Reform Act of 2011, and the report issued in response to Senate Resolution 29, which directed the Center to study the potential for the increased extension of natural gas distribution infrastructure by Pennsylvania’s natural gas public utilities to unserved and under-served areas.
Our work here, whether it’s part of our everyday responsibilities or something that needs immediate attention, is always based on our mission of providing timely research and data to help us better understand the trends, conditions and possibilities of our rural communities and our commonwealth. While we can never determine what the year or years may have in store, we know that we will continue to provide Pennsylvania residents with useful and timely information, and we look forward to another interesting year ahead.
On behalf of the Center’s Board of Directors and staff, all the best to you in the New Year.
Senator Gene Yaw
Municipal Expenditures for Volunteer Fire Services
Ninety-four percent of municipalities with fire companies rely on volunteers. To support these volunteer companies, municipalities provide annual contributions, which account for roughly 3 percent of all municipal expenditures.
In 2012, rural municipalities provided a median of $17,109 for fire services, or $18 per person, and urban municipalities provided $89,232 for fire services, or $27 per person, according to data from the Governor’s Center for Local Government Services. This analysis only includes data from the 2,329 municipalities that reported fire expenditures in 2012 and that rely on volunteer companies or have no fire company within their jurisdiction.
According to the analysis, 38 percent of rural municipalities did not have a fire company within their jurisdiction in 2012 and provided a median of $15,045 on fire services; 52 percent of rural municipalities had only one fire company located within their jurisdiction and provided a median of $17,022; and 10 percent of rural municipalities had two or more fire companies within their jurisdiction and provided a median of $42,928 on fire services.
The analysis also indicated that taxes, housing values, and income were positively correlated to rural municipal fire expenditures. This means municipalities that provided more money for fire services also collected more taxes, had higher housing values, and had more households with higher incomes.
However, there was a negative correlation between municipal fire expenditures and homeownership rates and population density, suggesting that those municipalities with higher homeownership rates and more persons per square mile had lower fire expenditures. There was no significant correlation between fire expenditures and the percent of single family homes (1 unit detached).
Among urban municipalities, there was a similar positive correlation between fire expenditures and taxes. There was, however, no significant relationship between fire expenditures and homeownership rates, population density, housing values and income.
From 2008 to 2012, rural municipal fire expenditures decreased 3 percent, on average, after adjusting for inflation. Rural municipalities with no fire company in their jurisdiction had a 1 percent increase in expenditures, as did those with two or more companies. Rural municipalities with one company within their jurisdiction had a 5 percent decrease in expenditures.
Urban municipalities had a 1 percent decrease in expenditures, on average, from 2008 to 2012. Urban municipalities with two or more fire companies in their jurisdiction had a 15 percent decrease in expenditures, on average. Urban municipalities with no fire companies had a 6 percent increase in expenditures and those with one company had a 10 percent increase.
According to 2011 data from the U.S. Census Bureau, local governments across the U.S. spent $42.2 billion on fire protection, or $136 per person. The states with the highest per capita expenditures were Colorado, Rhode Island and Alaska, each spending more than $230 per person. The states with the lowest expenditures were Pennsylvania, North Dakota and Delaware, each spending less than $55 per person.
Rural Snapshot: Rural Youth Education Project €“ Should I Stay Or Should I Go?
The Center for Rural Pennsylvania contracted with Pennsylvania State University researchers in 2004 to begin a longitudinal study of rural Pennsylvania school students to understand their educational, career and residential goals and the factors influencing these goals.
The Rural Youth Education Study followed two groups of youth from 11 rural Pennsylvania school districts. The study collected data every other year for four waves beginning in 2005.
At the beginning of the study, the younger group was in 7th grade and the older group was in 11th grade. By the final wave, the younger group was 1 year out of high school and the older group was 5 years out of high school.
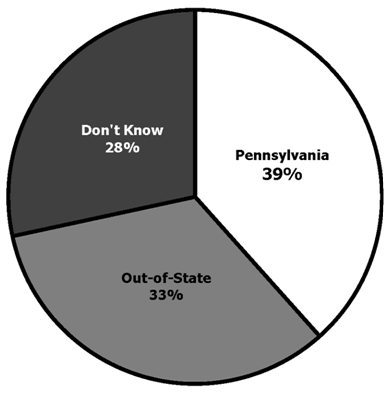
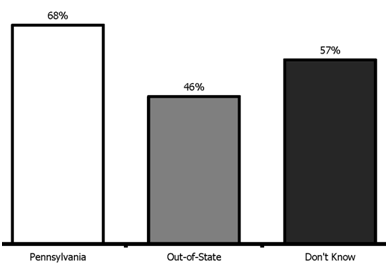
This installment of Rural Snapshot looks at the students who were in 11th grade during Wave 3 and their residential goals as adults. It compares those who want to stay in Pennsylvania, those who want to leave, and those who aren't sure where they want to live with other school- and non-school-related variables. Researchers who want access to the data for further analysis should call or email Jonathan Johnson at (717) 787-9555 or johnsonj@rural.palegislature.us.
Where Students Want to Live at Age 30 (Wave 3)
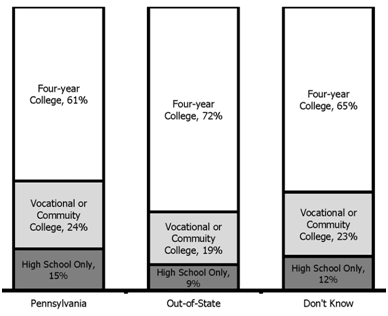
Students' Educational Goals According to Their Residential Goals at Age 30 (Wave 3)
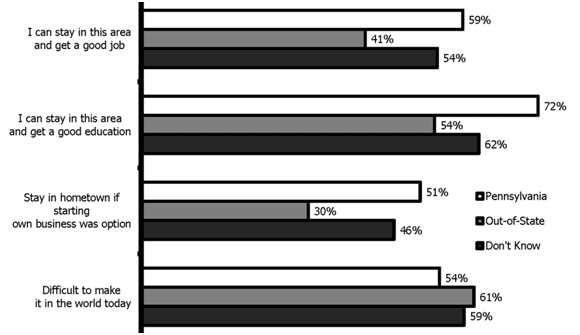
Percent of Students Who Agree or Strongly Agree with the Following Statements According to Their Residential Goals at Age 30 (Wave 3)
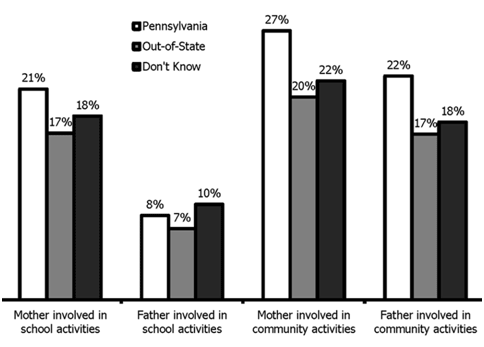
Parent Involvement in School and Community Activities According to Students' Residential Goals at Age 30 (Wave 3)
Percent of Students Who Agree or Strongly Agree that Their Family Feels Part of the Community According to Students' Residential Goals at Age 30 (Wave 3)
On the Trail of Pennsylvania's Limited Wineries
A growing segment of Pennsylvania’s tourism industry is wineries. According to licensing data from the Pennsylvania Liquor Control Board (PLCB), in June 2014, there were 246 wineries in Pennsylvania. These limited wineries, which are licensed to sell wine directly to the public, are located in 55 of the state’s 67 counties.
Many of these wineries are linked together along wine trails. According to the Pennsylvania Wine Association, there are 12 recognized wine trails throughout the state.
Nationwide, there are more than 9,800 wine producers and blenders, according to the U.S. Alcohol and Tobacco Tax and Trade Bureau. The three states with the most producers are all on the west coast: California (4,029), Washington (933), and Oregon (547). Pennsylvania has the nation’s 8th largest number of producers.
In Pennsylvania, winemaking and limited wineries are a growing industry. A 2011 study by the Pennsylvania Wine Association found that Pennsylvania wineries produced 1.23 million gallons of wine, ranking Pennsylvania 12th in the nation for production. Pennsylvania also ranked 5th in the nation for grape production.
As of 2011, total tax revenues collected from this industry totaled $186 million, and total employment reached 8,600. Overall, the industry has an economic impact of nearly $1.9 billion on Pennsylvania’s economy.
The popularity of wine can be measured in sales. According to data from the PLCB, wine sales in its stores have increased 26 percent from 2007 to 2013. These wine sales include wine from Pennsylvania as well as from other states and countries. Nationwide, the Wine Institute estimated that U.S. wine sales have increased 6 percent during this same period.
Pennsylvania's Limited Wineries by Zip Code*, 2014
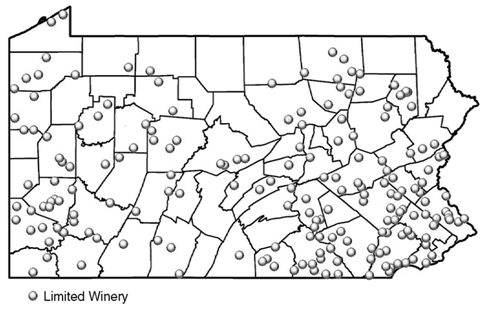
*Approximate location of licensed limited wineries. Limited winery licenses can be held by any in-state or out-of-state winery that produces alcoholic ciders, wines and wine coolers not to exceed 200,000 gallons per year. They may sell their products to individuals at retail on the licensed premises, to the PLCB, hotel, restaurant, club, brewery pubs and public service liquor licensees. Limited wineries may further provide visitors on the licensed premises with samples of wines for tasting at no charge. Data source: Pennsylvania Liquor Control Board.
Did You Know . . .
- Pennsylvania has more than 500,000 acres in the state Farmland Preservation Program. To date, 4,704 farms across 57 participating counties are enrolled in the program. (Pennsylvania Department of Agriculture)
- Pennsylvania farms sold more than $18.9 million worth of pumpkins in 2012. (U.S. Department of Agriculture, National Agricultural Statistics Service)
- Pennsylvania farms sold more than $40 million worth of sweet corn in 2012. (U.S. Department of Agriculture, National Agricultural Statistics Service)
- In 2012, there were 485 turkey farms in Pennsylvania that sold more than 8.5 million turkeys. (U.S. Department of Agriculture, National Agricultural Statistics Service)
Just the Facts: Super Commuters
There are commuters and then there are SUPER COMMUTERS. These are the folks who, according to the Center’s definition, are 18 years old and older, are employed, and are traveling 60 minutes or more to work.
According to 2008-12 data from the American Community Survey, nationwide, there are more than 10.8 million super commuters, or 8 percent of the roughly 134 million total commuters in the United States.
The states with the highest percentages of super commuters are New York, with 16 percent, and Maryland and New Jersey, each with 14 percent.
In Pennsylvania, nearly 5.6 million commuters travel to their jobs each day. Of this total, more than 464,000 are super commuters, or 8 percent of the total number of commuters in Pennsylvania.
Among Pennsylvania’s 67 counties, Pike and Monroe counties, which are on the eastern border of the state, have the highest percentages of super commuters at 28 percent and 25 percent, respectively. Juniata and Fulton counties each have the next highest percentages, with 16 percent. The counties with the lowest percentages of super commuters are Erie, Elk, Centre, and Cumberland, each with 3 percent.
According to data from the 2012 American Community Survey, Public Use Microdata Sample (ACS-PUMS), there are more male super commuters than female super commuters in both rural and urban Pennsylvania, with 68 percent of rural males and 59 percent of urban males considered super commuters.
Seventy-five percent of rural and 62 percent of urban super commuters travel alone to work by either car or truck. More super commuters than regular commuters are married (65 percent rural and 56 percent urban), but the percentages of divorcees among super and regular commuters are roughly the same, (nearly 10 percent for rural and urban super commuters and nearly 11 percent for rural and urban regular commuters).
A majority of super commuters in rural and urban Pennsylvania are full-time workers and earned more money than regular commuters. The median earnings for rural super commuters are $42,429 compared to $30,306 for rural commuters. The median earnings for urban super commuters are $45,459 compared to $35,357 for urban commuters.
