Newsletters
- Home
- Publications
- Newsletter Archive
- Newsletter
September/October 2013
Inside This Issue:
- Microfinancing Helps Sustain Economic Growth in Rural Pennsylvania
- Chairman's Message
- Researchers Present Initial Findings at Center Board Meeting
- Rural Snapshot: Working Poor
- Adults Seeking Help for Gambling Addiction
- What's the Score? Students and the SAT
- Just the Facts: PACE and PACENET
Microfinancing Helps Sustain Economic Growth in Rural Pennsylvania
Research sponsored by the Center for Rural Pennsylvania indicates that providing microloans to small businesses in rural counties is a viable economic development strategy for specific rural areas with established growth potential. However, these loans are not sufficient to jump-start or sustain growth in an area that is languishing economically.
The research, conducted by Dr. Gayle A. Morris of Edinboro University of Pennsylvania in 2011, analyzed the role of microfinancing programs in providing financial services to small businesses primarily located in rural Pennsylvania counties. Microfinancing focuses on providing microloans, which are loans less than or equal to $50,000, to individuals who typically operate a very small business (five employees or fewer).
Specifically, the research provided: an overview of currently functioning microfinance programs in Pennsylvania; information on a select number of microfinance programs serving rural Pennsylvania counties; and an assessment of the barriers and opportunities for lending institutions in providing microfinancing services, and for borrowers in accessing these financial services.
To conduct the study, the researcher compiled an overview of currently functioning microfinance programs in Pennsylvania, surveyed organizations providing microfinancing programs and interviewed personnel of those programs. She also selected three microfinancing programs serving rural clients in Pennsylvania for in-depth analysis.
To examine barriers and opportunities for commercial banks to provide financial services and for borrowers to access these services, the researcher used primary and secondary data and interviewed several commercial bank lenders. She also used secondary data to identify and project the supply of and demand for microfinancing services.
According to the research results, microloan borrowers sustained, and at times increased, the economic growth of a rural area/town in which they were located.
Also, the research indicated that continued constraints on the Pennsylvania state budget will probably mean that funding of small business lending will increasingly come from the federal government and the private sector.
The research also found that the economic downturn, beginning in 2008, increased the movement of small business borrowers from big banks to small banks and alternate lenders.
For a copy of the research report, The Economic Viability of Microfinancing in Pennsylvania, call or email the Center for Rural Pennsylvania at (717) 787-9555 or mailto:info@rural.palegislature.us, or visit www.rural.palegislature.us.
Chairman's Message
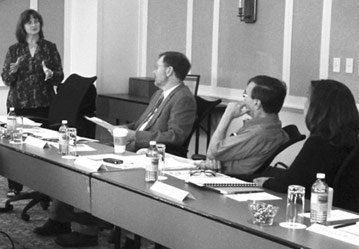
Before its August meeting in Bedford County, the Center’s Board of Directors had the opportunity to meet with representatives from the Bedford County Development Association, the president of MDL Manufacturing Industries, Inc., and company representatives of Recreational Equipment, Inc.
Bette Slayton, president and CEO of the association, and association Board Chair Marcia O’Rear and Board Treasurer Brooks Shoemaker, gave the board an overview of the steady job growth that has been taking place in the county. They also told us about the association’s work and commitment toward continuing that growth.
The board also talked with Doug Lingsch, president of MDL Manufacturing, which was recognized by Letterkenny Army Depot as Supplier of the Year in 2008-2009. Doug offered a tour of his company and told us how important state programs, such as the Pennsylvania Industrial Development Authority, and funding, such as the Machinery and Equipment Loan Fund, are to entrepreneurs who are starting and growing their businesses. Doug joked that credit cards and family were two microfinancing options that helped him kick-start his business. But research has confirmed how crucial microfinancing can be to small business owners who want to start or expand their business. Our recently released report on microfinancing, which is featured on Page 1, helps validate the idea that microfinancing not only helps rural small businesses succeed, but also helps the rural communities in which they operate to benefit. The board saw firsthand how businesses like Doug’s were helping their communities and the residents living in those communities.
Company representatives of REI, the outdoor gear retailer, told us how the company made its decision to locate its distribution center in rural Bedford County about six years ago. The managers said that while tax incentives were helpful, it was the transportation infrastructure, the quality workforce, and the location that particularly influenced the company’s decision to build its warehouse in the county.
The board was very impressed with the information and personal stories that all of these individuals shared, and was grateful for the opportunity to learn how federal, state and local programs and initiatives are making a difference in this rural Pennsylvania county.Senator Gene Yaw
Researchers Present Initial Findings at Center Board Meeting
At the August meeting of the Center for Rural Pennsylvania’s Board of Directors, researchers from Penn State University presented the preliminary findings from two research projects related to Marcellus Shale development and the extension of natural gas distribution infrastructure.
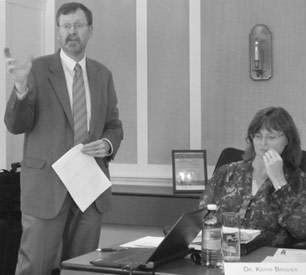
Dr. Kathy Brasier and Dr. Timothy Kelsey presented the first wave results of a longitudinal study on the community and economic impacts of Marcellus Shale development. The study, which began in 2011, is being conducted by an interdisciplinary team of researchers to chronicle community change occurring in Greene and Washington counties in the southwest region and Bradford and Lycoming counties in the north central region of the state. The research team will be completing its analysis over the coming months.
Dr. Richard Ready presented the methodology for a study to determine the potential for the increased extension of natural gas distribution infrastructure by Pennsylvania’s natural gas public utilities to un-served and underserved areas. Dr. Ready will be working over the next several weeks to complete the final analysis of the data.
|
|
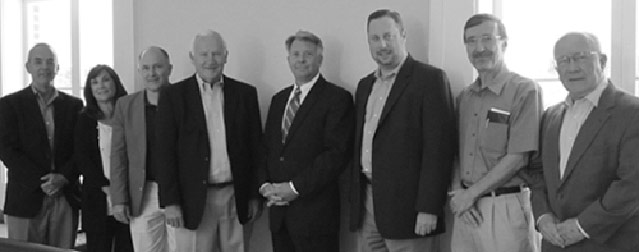
Center board members left to right: Rep. Garth Everett, Dr. Nancy Falvo, Rep. Rick Mirabito, Sen. Gene Yaw, Sen. John Wozniak,
Stephen Brame, Dr. Stephan Goetz and Dr. Ted Alter.
Rural Snapshot: Working Poor
There are 177,051 working rural Pennsylvanians, or 10 percent of the total rural employed population, whose total household incomes are less than 150 percent of the poverty level, according to 2011 Census data.
In urban Pennsylvania, there are 321,644 working Pennsylvanians, or 9 percent of the total urban employed population, whose total household incomes are less than 150 percent of the poverty level.
To learn more about Pennsylvania’s “working poor,” the Center for Rural Pennsylvania analyzed 2011 data from the American Community Survey, Public Use Microdata Sample (ACS-PUMS).
The Center identified a person as “working poor” if he/she worked 10 or more hours a week, was 18 years old or older, and had a total household income of less than 150 percent of the poverty level, which was $26,874 for a family of three in 2011. The 150 percent threshold was selected because it represents working persons who are in or near poverty. The analysis excludes people in an institution, such as a prison or nursing home, and those enrolled in school who are under age 25.
Age, Sex and Race
The average age of a rural working poor person is 38.5 and the average age of an urban working poor person is 38 years old.
Fifty-four percent of the rural working poor are female and 46 percent are male. Fifty-seven percent of the urban working poor are female and 43 percent are male.
Ninety-one percent of the rural working poor are white and 9 percent are non-white. Sixty-three percent of the urban working poor are white and 37 percent are non-white.
Thirty-eight percent of the rural working poor have never been married, 35 percent are married, and the remaining 27 percent are widowed, divorced, or separated. Among the urban working poor, 51 percent have never been married, 27 percent are married, and 22 percent are widowed, divorced, or separated.
Ninety-five percent of the rural working poor were born in the U.S. and 5 percent were foreign born. Eighty-four percent of the urban working poor were born in the U.S. and 16 percent were foreign born.
Households
Seventy-seven percent of the rural working poor live in a household with other people, 23 percent live alone. Seventy-four percent of the urban working poor live with other people and 26 percent live alone.
On average, there are 3.0 persons in both rural and urban working poor households.
Thirty-three percent of the rural working poor are single parents and 38 percent of the urban working poor are single parents.
Fifty-four percent of rural working poor households have children under age 18. On average, they have 1.2 children. These rates are the nearly the same for urban working poor households.
Housing
Fifty-three percent of the rural working poor are renters; their median monthly rent is $682, or approximately 46 percent of their total household income.
For rural homeowners (47 percent), their home has a median value of $80,000 and their median monthly housing costs, such as mortgages and insurance, are $723, or 44 percent of their total household income.
Among the urban working poor, 69 percent are renters; their median monthly rent is $840, or approximately 57 percent of their total household income.
For urban homeowners (31 percent), their home has a median value of $110,000. Their median monthly housing costs are $895, or 57 percent of their total household income.
Twenty-seven percent of the rural working poor have lived in the same home for less than 2 years and 32 percent of the urban working poor have lived in the same home for less than 2 years.
Transportation
Nine percent of rural and 26 percent of urban working poor do not have access to vehicles at their home.
To get to work, 89 percent of the rural working poor drive a car, truck or motorcycle (either alone or in a car pool); 8 percent walk or bicycle; and 3 percent use public transportation or other methods.
Five percent of the rural working poor work from home.
Among the urban working poor who work out of their home, 71 percent drive to work; 10 percent walk or bike; and 19 percent use public transportation or other methods to get to work.
Four percent of the urban working poor work from home.
The average commute time for the rural working poor is 22.4 minutes and for the urban working poor it is 26.0 minutes.
Education
Fifteen percent of the rural working poor do not have a high school diploma; 49 percent have a high school diploma only; 18 percent have some college education, but no degree; and 18 percent have an associate’s degree or higher.
Seventeen percent of the urban working poor do not have a high school diploma; 41 percent have a high school diploma only; 22 percent have some college, but no degree; and 20 percent have an associate’s degree or higher.
Five percent of rural working poor persons who are 25 years old and older are enrolled in school; that is, they are working and taking classes. Among similarly aged urban working poor, 7 percent are enrolled in school.
Employment
Sixty percent of rural and 59 percent of urban working poor are employed full-time (35+ hours a week). The median wage and salary for these workers is $15,274 in rural and $14,255 in urban.
Forty percent of rural and 41 percent of urban working poor are employed part-time (<35 hours per week). The median wage and salary for these workers is $8,451 in rural and $8,248 in urban.
Seventy-four percent of rural working poor work for a private, for-profit company; 8 percent are employed by a nonprofit organization; 6 percent work for a government agency (local, state, or federal); and 12 percent are self-employed. Seventy-five percent of urban working poor are employed by a private for-profit company; 9 percent work for a nonprofit organization; 5 percent work for a government agency; and 11 percent are self-employed.
The top three occupations for rural and urban working poor are: sales (13 percent); food services (12 percent); and office support (11 percent).
Sixty-seven percent of rural working poor families have only one person employed and 33 percent have two or more persons employed. Among urban working poor families, 68 percent have one person working and 32 percent have two or more persons working.
Income
The median household income for the rural working poor is $18,481. For the urban working poor, the median household income is $16,903.
Thirty-nine percent of rural working poor households receive SNAP (food stamp) payments and 40 percent of urban working poor households receive SNAP.
The income levels for 45 percent of the rural working poor are below poverty, and for 55 percent, their incomes are from 100 to 149 percent of poverty. The income levels for 49 percent of the urban working poor are below poverty, and for 51 percent, their incomes are from 100 to 149 percent of poverty.
Disabilities and Health Insurance
Ten percent of the rural and 8 percent of the urban working poor have a disability. The most common disability for both rural and urban persons was a cognitive difficulty, such as having serious difficulty concentrating, remembering or making decisions because of mental or emotional conditions.
Thirty-nine percent of the rural working poor have no health insurance coverage and 40 percent of the urban working poor are uninsured.
Among the rural working poor with health insurance coverage, 60 percent are insured through a private health insurance company, either through an employer or private purchase; 33 percent are covered through public health insurance, such as Medicaid or Medicare; and 7 percent are covered through both private and public insurers.
Among the urban working poor with health insurance coverage, 60 percent are insured through a private company; 34 percent through a public organization; and 6 percent through a mixture of public and private insurers.
National Comparison
Throughout the U.S., there are 16.9 million working poor, or 13 percent of the total employed population (18 years old and older).
Mississippi, New Mexico, Idaho and Arkansas have the nation’s highest percentages of working poor, each with 17 percent of the employed population. Massachusetts, Maryland and New Hampshire have the lowest percentages of working poor, each with less than 8 percent of the total employed population.
Ranking from highest to lowest among the 50 states, Pennsylvania was 43rd in the percentage of working poor, with 498,695 persons, or 9 percent of the total employed population.Adults Seeking Help for Gambling Addiction
According to the Pennsylvania Department of Drug and Alcohol Programs, legalized gambling is one of the fastest growing industries in the United States. In Pennsylvania, the department collects data on adults who seek help for gambling addiction.
According to 2011-12 records from the Department of Drug and Alcohol Programs, 1,731 rural adults, or 53 out of every 100,000 rural adults, sought help for gambling addiction from a rural Single County Authority (SCA). SCAs are county service agencies that receive state and federal dollars through the Department of Drug and Alcohol Programs to plan, coordinate, manage and implement drug and alcohol prevention, intervention, and treatment services at the local level.
In 2011-12, 5,400 urban adults, or 80 out of every 100,000 urban adults, sought help for gambling addiction from an urban SCA.
In 2011-12, rural SCAs received nearly $885,129 from the Compulsive and Problem Gambling Treatment Fund, which is administered by the Department of Drug and Alcohol Programs and funded by fees assessed on monies generated by licensed gaming entities. In 2011-12, the average cost for services for rural clients was $511.
In 2011-12, urban SCAs received $2.1 million from the fund. The average cost for services for urban clients was $392.
From 2010-11 to 2011-12, there was a 4 percent decline in the number of adults seeking help from rural SCAs and a 24 percent increase in those seeking help from urban SCAs.
What's the Score? Students and the SAT
Colleges and universities use SAT scores to evaluate the academic potential of new students.
In general, fewer rural students take the SAT than urban students and rural student SAT scores are lower than urban student scores.
Over the 3-year period of 2010 to 2012, 29 percent of rural 11th and 12th graders took the SAT. During this period, their average score was 980 (495 in math and 485 in verbal) out of a possible 1,600 points (800 math and 800 verbal).
Among urban districts, 33 percent of students in 11th and 12th grade took the test and scored an average total of 1,001 (507 in math and 493 in verbal) during the same period. The difference between rural and urban districts was statistically significant.
To learn if any economic or socioeconomic factors may be associated with rural or urban SAT scores, the Center examined data from the Pennsylvania Department of Education and the U.S. Census Bureau.
Among the items significantly correlated with SAT scores in rural districts were: student/teacher ratios, median household income, and the percent of students eligible for the free and reduced school lunch program. For student/teachers ratios and median household incomes, the correlations were positive, meaning the higher the ratio and incomes, the higher the test scores. For the school lunch program, the correlation was negative, meaning the higher the percentage of students eligible for the program, the lower the SAT scores.
Among the factors not significantly correlated with SAT scores were total district expenditures per student and the percent of expenditures for student activities, such as sports, plays and clubs.
For urban districts, SAT scores were positively correlated with household income and the percent of expenditures for student activities. In each case, the higher these indicators, the higher the test scores.
Like rural districts, urban districts also had a negative correlation with the percent of students enrolled in the school lunch program.
According to the nonprofit organization, College Board, which administers the SAT, in 2012, Pennsylvania had the 38th highest SAT scores nationwide with 981. This score includes students attending both public and private schools. The nationwide average score in 2012 was 1,002.
Illinois, Iowa and Wisconsin had the nation’s highest scores, each with an average score greater than 1,181.
South Carolina, Maine and Delaware had the nation’s lowest scores, each with scores of 950 or less.
Just the Facts: PACE and PACENET
The Pennsylvania Department of Aging provides a prescription assistance program called PACE for low-income seniors age 65 or older. PACENET is a similar program for moderately low-income seniors.
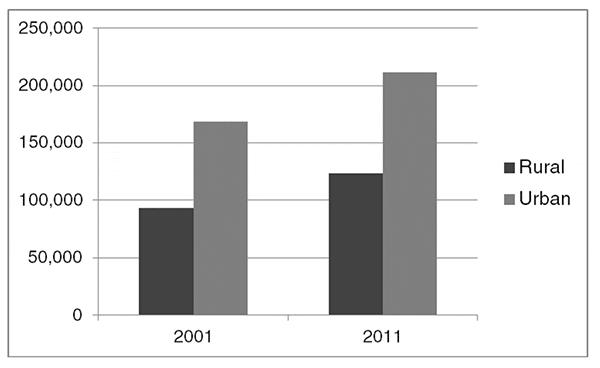
In 2001, there were 261,796 total enrollees in these programs statewide. By 2011, enrollment was 335,001, an increase of 28 percent. Both rural and urban enrollment increased.
Rural enrollment was 93,406 in 2001, and 123,302 in 2011, a 32 percent increase over the 10-year period. Urban enrollment was 168,390 in 2001 and 211,699 in 2011, a 26 percent increase over the 10-year period.
The PACE/PACENET programs are administered with the participation of retail, nursing home, and mail-order providers of pharmaceuticals. Statewide, there were 10.9 PACE/PACENET participating providers per 1,000 enrollees in 2001.
In 2011, there were 8.8 participating providers per 1,000 enrollees, a decrease of 19 percent from 2001. Rural counties saw a change in providers per 1,000 enrollees, from 8.8 in 2001 to 6.6 in 2011, a decrease of 25 percent.
Urban counties witnessed a 16 percent decrease in providers from 12.0 providers in 2001 to 10.1 providers per 1,000 enrollees in 2011.
In 2006, PACE/PACENET coverage was supplemented with the new Medicare Part D prescription coverage. As a result, the inflation-adjusted state share in the cost of the program decreased dramatically from $497.3 million in 2001 to $216.2 million in 2011.
PACE/PACENET Enrollment in Rural and Urban Pennsylvania Counties, 2001 and 2011
Data source: Pennsylvania Department of Aging.

