Newsletters
- Home
- Publications
- Newsletter Archive
- Newsletter
July/August 2014
Inside This Issue:
- Research Examines Charter School Enrollment Trends and Financial Impacts on Pennsylvania School Districts
- Comparison of Rural, Urban Municipal Pension Plans
- Chairman's Message
- Research Compares Cancer Incidence, Mortality Rates in PA, U.S.
- Rural Snapshot: Rural Youth Education Study €“ Participation in School/Community Activities
- 2012 Census of Agriculture Highlights
- Just the Facts: Taxes and Charitable Donations
Research Examines Charter School Enrollment Trends and Financial Impacts on Pennsylvania School Districts
Student enrollment in Pennsylvania charter schools has grown dramatically since the mid-2000s. Between 2006-07 and 2010-11, charter school enrollment increased by 54 percent from about 58,000 students to more than 90,000 students. Cyber charter schools grew 75 percent during the same 5-year period. Charter school enrollment in Pennsylvania, as nationally, is overwhelmingly urban. By 2010-11, only slightly more than 1 percent of all charter school students attended rural charter schools.
To assess charter school enrollment trends in Pennsylvania and the financial impacts of charters and cyber charters on traditional K-12 school districts, researchers from Penn State University studied data for academic years (AY) 2006-2007 through 2010-2011, the most recent years for which data were available. The researchers, Dr. Kai A. Schafft, Dr. Erica Frankenberg, Dr. Ed Fuller, Dr. William Hartman, Dr. Stephen Kotok and Bryan Mann, also analyzed how these impacts may vary according to urban and rural location and districts' student racial/ethnic demographics. The research was sponsored by the Center for Rural Pennsylvania.
According to the research, urban "brick and mortar" (non-cyber) charter schools are disproportionately non-white in comparison to traditional public schools, and have become more so over time, which directly contrasts with cyber charter school enrollments. By 2010-11, urban brick and mortar charter school enrollments were nearly 80 percent non-white, while the reverse was true for cyber charter enrollments. Brick and mortar charter schools with high non-white student concentrations are disproportionately likely to be located in low-wealth areas. Rural charter schools are also disproportionately non-white in comparison to traditional rural K-12 school districts.
Pennsylvania school districts are mandated to fund the charter schools their students attend based on a per-student tuition payment, which is determined by the sending district's expenditure level. Between 2006-07 and 2011-12, school district payments to charter schools increased annually from $527 million to $1.145 billion, with total disbursements over the time period from both local and state sources amounting to $4.777 billion. Of this $4.777 billion, 12 percent was contributed by rural school districts. In 2011-12, the annual increase in the traditional public school district tuition payments made to charter schools exceeded the increase in revenues generated from real estate taxes, thus implying that many districts must divert funds from existing instructional programs and services to pay for charter school student tuition. In total, urban school districts have experienced the greatest financial burden, given the proportion of charter school students originating in those districts.
Importantly, the available data suggest that students moving from a traditional public school district to a charter school generally move to a school with lower academic performance than the original district.
In regard to students with individual education plans (IEPs), the research found that more scrutiny needs to be put on charter schools to ensure they are providing for similar types and proportions of special needs students in a cost effective manner. A single payment amount for all types of special education students does not reflect the wide variation in the costs of different types and intensities of services that various students need. Under the current funding formula for special education tuition payments, charter schools received substantially more in tuition payments for special education students than they reported spending for special education.
The growing financial impact on local taxpayers of the increasing number of students attending charter schools and the current funding system that places the full responsibility for charter school costs on school districts is clear. While the rapid expansion of charter schools, especially cyber charter schools, may provide some parents with more school choices, policy makers need to be cognizant of the financial impact that these policies place on traditional schools and districts. Given the increasing amount of state and local disbursements to charter schools, this raises difficult policy questions regarding public investments in charter schools and the educational services provided to Pennsylvania students.
For a copy of the report, Assessing the Enrollment Trends and Financial Impacts of Charter Schools on Rural and Non-Rural School Districts in Pennsylvania, visit the Center's website at www.rural.palegislature.us.
Comparison of Rural, Urban Municipal Pension Plans
The Center for Rural Pennsylvania has released the report, Status of Pennsylvania's Municipal Pensions, which was conducted by Dr. Jeffrey A. Weber, Dr. Sheila A. Handy and Nemanja Nikolic of East Stroudsburg University of Pennsylvania. The report describes research that examined Pennsylvania's rural and urban municipal pension plans and trends in pension data over the 10-year period of 2001 to 2011.
The research found that urban municipal pension plans rather than rural municipal pension plans tended to have unfunded liability over the study period. The trends in the data indicated that urban municipalities have had pension plans with unfunded liabilities since 2001 and that the liabilities have increased over time, especially since 2009. Despite the upswing in the market from 2010 to 2011, the urban plans' unfunded liability continued to increase. This indicates that urban municipal pension plans are not underfunded due to the downturn in the market, but instead may have systematic structural issues within the plans.
Copies of the report, Status of Pennsylvania's Municipal Pensions, are available at www.rural.palegislature.us.
Chairman's Message
The Center for Rural Pennsylvania's yearly Research Grant Program identifies topics for study that are important to our rural communities. These topics range from rural people and communities to health and welfare concerns. The results of this research help to build a stronger base of information about certain issues that have not been previously examined and more details about other issues that have been studied, but not from a rural perspective.
The information featured on Pages 1 and 3 describes the results of three recently released research reports on charter school enrollment trends, municipal pension plans and cancer incidence and mortality rates that add to our basic understanding of these issues and provides greater detail from a rural angle. All reports are available on the Center's website.
At times, the Center also looks to gather information about certain topics outside of its grant program, especially when topics come quickly to the boiling point. Over the past months, heroin addiction and overdose deaths have been making headlines all across Pennsylvania. This dangerous narcotic has made its way into our counties and municipalities and has affected residents without regard to age, gender, race, socioeconomic background or geography.
According to a 2014 report from the Pennsylvania State Coroners Association, the number of fatal heroin overdoses has been increasing over the last several years. In 2009, there were 45 reported heroin deaths. For just the first half of 2013, the number of heroin deaths numbered 124.
To learn more about the increasing use of heroin and other opioids in rural Pennsylvania, and to determine what can be done to address this growing public health crisis, the Center for Rural Pennsylvania is sponsoring four public hearings across the state in July and August. The Center expects to hear from a wide range of professionals, including judges, district attorneys, police, health care providers and counselors, who will provide their perspective on the use and availability of these drugs and the potential solutions that go beyond simply locking people behind bars.
The hearings have been scheduled for July 9 in Williamsport, July 22 in Reading, August 5 in Loretto, and August 19 in Clarion. More information on the locations and times of the hearings is available on the Center's website. It is our hope that the information gathered from these hearings may be used by the General Assembly to develop legislation that will help curb the use and availability of these drugs.
We'll be sure to keep you posted on the outcomes from these hearings.
Senator Gene Yaw
Editor's note: More information on the July 9 hearing in Williamsport is available hereResearch Compares Cancer Incidence, Mortality Rates in PA, U.S.
Pennsylvania has the 8th highest cancer incidence rate among all states and the 17th highest cancer mortality rate among all states.
To learn more about cancer incidence and mortality rates in rural Pennsylvania, Dr. Steven Godin of East Stroudsburg University and a team of researchers compared cancer incidence and mortality in rural Pennsylvania counties with those in urban Pennsylvania counties, rural Appalachia, and rural U.S. counties.
The research was sponsored by the Center for Rural Pennsylvania. The research team included Dr. Samuel Lesko of the Northeast Regional Cancer Institute; Dr. Eugene Lengerich of Penn State University; and Dr. David Rheinheimer, Gary Fromert and Pragati Jain of East Stroudsburg University.
Overall, the research indicated that cancer incidence in men and women in rural Pennsylvania was significantly higher when compared to other rural counties throughout the U.S.
In terms of mortality, rates in rural Pennsylvania counties were either on par with, or significantly better than rates in urban Pennsylvania counties, rural U.S. counties, and rural Appalachian counties. However, this was not true for breast cancer mortality.
For a copy of the report, Comparisons of Cancer Incidence and Mortality for Rural vs. Urban Pennsylvania Counties, Rural Appalachian Counties, and Rural U.S. Counties, visit the Center's website at www.rural.palegislature.us.
Rural Snapshot: Rural Youth Education Study €“ Participation in School/Community Activities
The Center for Rural Pennsylvania contracted with Pennsylvania State University researchers in 2004 to begin a longitudinal study of rural Pennsylvania school students to understand their educational, career and residential goals and the factors influencing these goals.
The Rural Youth Education Study followed two groups of youth from 11 rural Pennsylvania school districts. The study collected data every other year for four waves beginning in 2005.
At the beginning of the study, the younger group was in 7th grade and the older group was in 11th grade. By the final wave, the younger group was 1 year out of high school and the older group was 5 years out of high school.
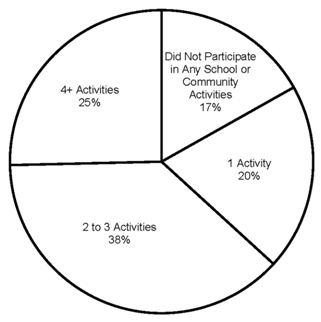
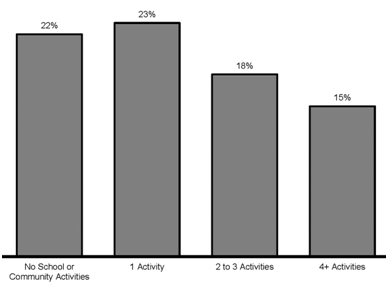
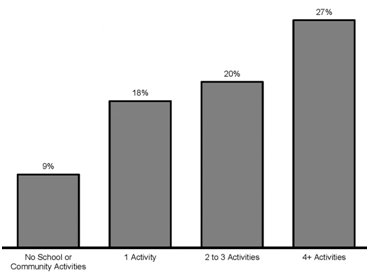
This installment of Rural Snapshot presents a picture of the younger group of students, who were in 7th grade during Wave 1 and 11th grade during Wave 3, and their involvement in school and community activities. For the analysis, students were grouped into four school/community-activity participation categories as follows: no participation, one activity, two to three activities, and four or more activities. The survey responses from students in the various activity participation categories were then compared to their responses for various questions about their educational, residential and career goals. Please note that students did not provide the number of hours they participated in the various activities.
Researchers who want access to the data for further analysis should call or email Jonathan Johnson at (717) 787-9555 or johnsonj@rural.palegislature.us.
Types of School and Community Activities in Which Students Participated, Wave 3
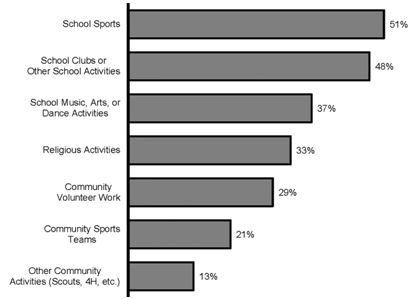
Note: Totals do not add up to 100 percent due to students participating in multiple activities.
Number of School and Community Activities in Which Students Participated, Wave 3
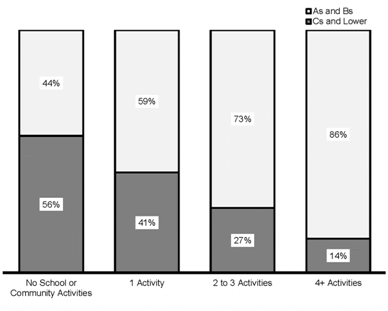
Prior Year Student Grades by Number of School and Community Activities, Wave 3
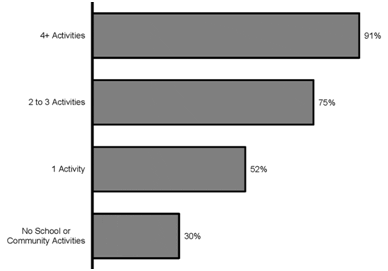
Percent of Students Who Want to Go to a 4-Year College by Number of School and Community Activities, Wave 3
Percent of Students Who Strongly Agree That They Would Like to Open Their Own Business by Number of School and Community Activities, Wave 3
Percent of Students Who Strongly Agree That Their Community is a Good Place to Raise a Family, by Number of School and Community Activities, Wave 3
2012 Census of Agriculture Highlights
Every 5 years, the U.S. Department of Agriculture's National Agricultural Statistical Service (NASS) conducts the Census of Agriculture to look at a wide range of issues on farms, farming and farmers. In May, NASS released data from the 2012 Census of Agriculture. Following are some highlights and comparisons with the 2007 ag census.
In 2012, there were 59,309 farms in Pennsylvania, a decrease of 6 percent from 2007. Nationwide, there were more than 2.1 million farms, a decrease of 4 percent from 2007.
The three Pennsylvania counties with largest increases in the number of farms were Potter, Philadelphia and Wayne, each with an increase of more than 16 percent. The three counties with the largest decreases were Elk, Forest and Greene, each with a decrease of 28 percent or more.
In 2012, Pennsylvania farms sold more than $7.4 billion of agricultural products. Fifty-two percent of these sales occurred in seven south-central Pennsylvania counties: Adams, Berks, Chester, Franklin, Lancaster, Lebanon and York.
Pennsylvania had a slight decrease in farmland from 2007 to 2012. In 2012, there were 7.7 million acres of farmland, a decrease of 1 percent from 2007. Pennsylvania is one of 31 states with a decrease in farmland.
Twenty-seven of Pennsylvania's 67 counties gained farmland from 2007 to 2012. The three counties with the largest increases were Dauphin, Sullivan and Union, each with a 34 percent or higher increase. Among the 40 counties that lost farmland were Elk, Greene and Montgomery, which had the greatest declines, each with more than 25 percent.
Chester, Lehigh and Franklin counties had the highest average market value for their land and buildings, each with an average farm market value of more than $1.1 million. The counties with the lowest farm market values were Elk, McKean and Warren, each with an average farm market value of less than $325,000.
From 2007 to 2012, the cost of fuel, gasoline and oil for Pennsylvania farmers increased. In 2007, the average inflation-adjusted cost of fuel per farm was $4,486; in 2012, the average was $5,465 per farm.
The average Pennsylvania farm paid $4,140 in property taxes in 2012, which was an increase of $3 from the inflation-adjusted average in 2007 of $4,137.
Pennsylvania has 581 organic farms, which account for 1 percent of all farms. Among all states, Pennsylvania ranked fifth in the total number of organic farms.
In 2012, women were the principal operators of 8,460 farms, or 14 percent of all farms. From 2007 to 2012, the number of women-operated farms decreased 1 percent.
In 2012, 25 percent (14,954 farms) of Pennsylvania farms employed hired labor. In 2007, 19 percent of all farms (11,722) employed hired labor.
In 2012, the average payroll per farm laborer in Pennsylvania was $10,255 and the average nationally was $9,862.
Pennsylvania had 4,268 migrant farm workers in 2012. Nationwide, there were 436,570 migrant farm workers.
In 2012, Pennsylvania farmers were 56.1 years old, on average. Nationwide, the average age of farmers was 58.3.
In 2012, 62 percent of Pennsylvania farms had Internet access. Of these farms, only 10 percent accessed the Internet through dial-up service. In 2007, 51 percent of Pennsylvania farms had Internet access. Nationwide, 70 percent of farms had Internet access in 2012 and 57 percent had access in 2007.
In 2012, 551 farms in Pennsylvania marketed products through Community Supported Agriculture (CSAs). From 2007 to 2012, the number of CSAs in Pennsylvania increased 45 percent. Lancaster, Berks and Chester counties had the most CSAs at 88, 38, and 33, respectively. Nationwide, there were 12,617 CSAs, an increase of 1 percent from 2007.
Finally, Fulton County was the only Pennsylvania county that had more cows (cattle and calves) than people. Nationwide, 1,113 counties, or 35 percent, had more cows than people.
For more about the 2012 Pennsylvania Census of Agriculture or to access the Pennsylvania data, which are available at both the state and county levels, visit www.nass.usda.gov/pa/.
Just the Facts: Taxes and Charitable Donations
In 2011, 17 percent of the 1.6 million rural Pennsylvania tax filers itemized their charitable contributions and 28 percent of the 4.6 million urban Pennsylvania tax filers itemized their contributions, according to 2011 aggregate data made available by the U.S. Internal Revenue Service (IRS). The data included, by county, the number of personal tax filers and their charitable contributions, but only included those taxpayers who itemized charitable contributions on their federal 1040 tax forms.
While these data have limitations, they provide a useful window for examining rural and urban charitable giving.
In this article, the federal tax filers who itemized their charitable contributions are called "charitable givers."
According to the data, there were 272,757 rural charitable givers in 2011, with total contributions totaling $1.0 billion. The 1.27 million urban charitable givers in 2011 made total contributions of $5.0 billion.
Rural charitable givers donated $3,677, on average, which was $279 less than the average donated by urban charitable givers ($3,956).
The data indicate that as income increases, so do charitable donations. Among rural charitable givers with incomes under $50,000, the average contribution was $2,103. Those with incomes of $50,000 to $99,999 gave an average of $2,719, and those with incomes of $100,000 or more gave an average of $5,616. There was a similar pattern among urban charitable givers.
In Pennsylvania, the three counties with the highest average charitable donations were Somerset, Montgomery, and Potter, each with more than $5,050. The three counties with the lowest average charitable donations were Monroe, Pike, and Carbon, each with less than $2,500.
Nationwide, there were 38.0 million charitable givers who donated more than $173.5 billion, or an average of $4,566. The three states with the highest average donations were Wyoming ($8,190), Utah ($7,590) and Texas ($6,448). The three states with the lowest average donations were New Hampshire, Maine, and Rhode Island. The average in each of these three New England states was less than $3,000.
Pennsylvania had a statewide average of $3,907 in charitable donations, the nation's 36th highest.
A 2010 national study by the IRS found that the majority of charitable givers (59 percent) made non-cash donations. The largest number of donations in this category was clothing and household goods (85 percent). These givers estimated that the average fair market value of their donations was $664.
