Newsletters
- Home
- Publications
- Newsletter Archive
- Newsletter
July/August 2013
Inside This Issue:
- Recession Placed Financial, Organizational Stress on State's Rural Nonprofits
- Chairman's Message
- A Closer Look at Nonprofit Employees
- Rural Snapshot: Young College Graduates
- Pennsylvania Results Now Available from National Survey of Anglers, Hunters and Wildlife Watchers
- Just the Facts: Substantiated Cases of Elder Abuse
Recession Placed Financial, Organizational Stress on State's Rural Nonprofits
Research to determine how the most recent economic downturn may have affected Pennsylvania rural nonprofits found that these organizations became financially and operationally stressed, as a significant number of these organizations had to make cuts to their programs and services during the downturn.
The research, conducted in 2011 and 2012 by Dr. Roberta Snow, Dr. Evan Leach and Michael Tomko of West Chester University, focused on whether the 2007€“2009 nationwide economic recession had an impact on nonprofit organizations with 501(c)3 public charity status serving Pennsylvania’s 48 rural counties.
The study used a pre- and post-recession analysis of mandatory IRS 990 financial filings for all Pennsylvania rural nonprofit organizations (NPOs). It also used data from a statewide survey of nonprofit organizations carried out by the United Way of Pennsylvania in 2011.
Results
The research found that 3,335 rural NPOs, with 501(c)3 public charity status, served Pennsylvania’s 48 rural counties.
According to the analysis of 2009 IRS 990 filings, more than 30 percent of Pennsylvania rural NPOs had negative operating margins. These organizations were running deficits and could be viewed as financially vulnerable at a time when the need for their programs and services was growing.
Moreover, when available 2005 IRS 990 filings were taken into account, the analysis revealed that, before the economic downturn, almost 75 percent of the vulnerable rural NPOs had been financially stable, were breaking even, or were generating a modest surplus. Conservatively, this finding suggests that the stability of the nonprofit sector in rural Pennsylvania is threatened by prevailing economic conditions. Revenues were decreasing while demand and associated expenses were increasing.
According to the research, this situation poses serious challenges for state, county, and local governments, private philanthropies, citizens, and rural NPOs.
The research examined conditions for nonprofits in other states and found that others were wrestling with similar trends and issues. The analysis found several promising policies and strategies that were in the development stages at the time of the research and determined that these efforts could be helpful if implemented in the commonwealth.
These efforts include: the development of a state-wide nonprofit database to provide accurate and well-managed information about individual nonprofits and the groups they serve; collaborative efforts of government, private philanthropic, and nonprofit leaders to increase efficiencies; governors’ initiatives that focus attention and effort on building a stable nonprofit sector; regulatory relief that streamlines contracting and reporting for increased efficiency; tax policy that maintains, and in some cases enhances, incentives for private donors; and social impact bonds, a funding mechanism developed in the United Kingdom for creating private investment pools to support nonprofit work normally funded directly by government.
For a copy of the research results, The Status of Rural Pennsylvania Nonprofits, call or email the Center at (717) 787-9555 or info@rural.palegislature.us or visit www.rural.palegislature.us.
Chairman's Message
Numbers. Some people thrive on them and the possible meaning behind them.
Others might be more leery of them, thinking that numbers may be used, or even abused, to support a particular point of view.
Either way, we can’t live without them, since we all use numbers to identify, classify, and distinguish.
This last category of using numbers to make distinctions can be helpful.
As you know, one of the Center’s legislative mandates is to develop and maintain an appropriate base of knowledge and information about rural conditions and needs.
Every issue of Rural Perspectives includes samples of information the Center for Rural Pennsylvania collects and maintains as part of its comprehensive database.
The data it has and shares can help us understand the diversity of issues and opportunities present in Pennsylvania. And that includes all of Pennsylvania, since the Center’s database includes information on all 67 counties €“ not only the 48 rural counties.
The Center uses a wide variety of sources to build its database: from the U.S. Census Bureau to the Pennsylvania Departments of Labor and Industry, Health, and Community and Economic Development to PA CleanWays, the Center taps into federal and state government sources as well as local and nonprofit organizations for the information they have and the data they track.
By working with these government and non-government organizations, the Center can offer you information on any number of topics.
In this issue of the newsletter, for example, you can learn more about nonprofit employees, young Pennsylvanians who earned postsecondary degrees, and the number of substantiated elder abuse cases in the state.
This is quite a mix of information. But this is information that people can use to support a grant request, appeal to their local government, or support public policy.
Through its close working relationship with our partners at the federal, state and local levels, the Center has developed one of the most comprehensive statewide databases on rural trends and conditions.
All of the numbers in its database have helped the Center to develop a clearer picture of rural Pennsylvania and to share that picture with you.
Senator Gene Yaw
A Closer Look at Nonprofit Employees
According to data from the U.S. Census Bureau, in 2007-11, more than 156,400 rural Pennsylvanians worked for a nonprofit organization. These individuals represent 10 percent of the entire rural workforce. From 2000 to 2007-11, the number of rural nonprofit workers increased 14 percent, while the number of workers for the entire rural workforce increased only 3 percent.
In urban Pennsylvania, more than 510,100 individuals, or 12 percent of the total urban workforce, worked for a nonprofit organization. From 2000 to 2007-11, the number of urban nonprofit workers increased 15 percent, while the entire urban workforce increased 6 percent.
Nationwide, 11.2 million people, or 8 percent of the total workforce, worked for a nonprofit organization. Among all 50 states, Vermont, Massachusetts, and Maine have the highest percentages of workers employed by nonprofit organizations. In each of these states, more than 12 percent of the workforce received a paycheck from nonprofit organizations. Texas, Mississippi, and Nevada had the lowest percentages of nonprofit workers, each with less than 6 percent of the workforce employed by nonprofit organizations. Pennsylvania had the nation’s fifth highest percentage of nonprofit workers with 11 percent.
To learn more about rural nonprofit workers, the Center for Rural Pennsylvania analyzed data from the 2011 American Community Survey, Public Use Microdata Sample.
According to the data, the typical rural adult (age 18+ years) who was employed by a nonprofit organization had the following characteristics.
| 45 years old | Average age |
| 69 percent | Female |
| 31 percent | Male |
| 41 percent | Bachelor's degree or higher |
| 63 percent | Employed full-time (35+ hours per week) and worked year-round (50+ week per year) |
| 57 percent | Management and/or professional occupation |
| 39 percent | Employed in health care, such as a hospital (20 percent were employed by educational organizations, 15 percent in service industries, 11 percent in human services and 15 percent in other industries) |
| $39,100 | Median wage for nonprofit workers who worked year-round and full-time |
| 6 percent | Had no health care insurance |
Rural Snapshot: Young College Graduates
Among the approximately 677,000 young adults (21 to 34 years old) living in rural Pennsylvania in 2011, 155,987, or 23 percent, had a bachelor’s degree or higher. In urban Pennsylvania, in 2011, there were approximately 1.52 million young adults, 35 percent (530,638) of whom had a bachelor’s degree or higher.
To learn more about these young college graduates, the Center for Rural Pennsylvania analyzed U.S. Census Bureau data from the 2011 American Community Survey, Public Use Microdata Sample (ACS-PUMS).
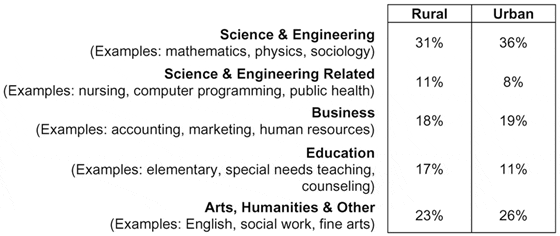
The ACS-PUMS asks graduates with a bachelor’s degree to report their specific major(s). Graduates can choose from a list of 188 possible majors. The Census Bureau then groups the majors into five broad categories as follows: science and engineering; science and engineering related; business; education; and arts, humanities and other.
For the analysis, the Center used the first listed major as the field of study for graduates, even though more than one major may have been listed. The Center excluded from the analysis persons in institutionalized group quarters (prisons, nursing homes, hospitals).
Field of Study
According to the ACS-PUMS data, science and engineering topped the list of majors for both rural and urban young graduates (31 percent and 36 percent, respectively) (See Table below).
Post-Grad Studies
The majority of young rural graduates (77 percent) did not have a post-graduate degree, such as a master’s or doctorate. Among the 23 percent of young rural graduates who earned a post-graduate degree, 82 percent had a master’s degree, 12 percent had a professional degree, such as a law or medical degree, and 6 percent had a doctorate.
The majority of young urban graduates (72 percent) did not have a post-graduate degree as well. Among the 28 percent who earned a post-graduate degree, 75 percent had a master’s degree, 16 percent had a professional degree, and 9 percent had a doctorate.
Among both rural and urban young graduates, approximately 23 percent were enrolled in school.
Gender and Race
Fifty-eight percent of young rural graduates were female and 42 percent were male. Among young urban graduates, 56 percent were female and 44 percent were male.
Five percent of young rural graduates were minorities (non-white, and/or Hispanic) and 22 percent of young urban graduates were minorities.
Marital Status and Family
Fifty-three percent of young rural graduates were never married, 45 percent were married, and 2 percent were divorced, separated, or widowed. Fifty-nine percent of young urban graduates were never married, 39 percent were married and about 2 percent were divorced, separated, or widowed.
On average, young rural graduates had 2.4 persons living in their households: 39 percent of these households had children and 61 percent did not. Young urban graduates had an average of 2.1 persons living in their households: 28 percent of these households had children and 72 percent did not.
Living Arrangements
Seventy-five percent of young rural graduates lived with family and 25 percent lived alone or with a non-family member, such as a roommate or unmarried partner. Estimates show that 27 percent of young rural graduates lived with a parent.
Sixty-four percent of young urban graduates lived with family and 36 percent lived alone or with a non-family member. Estimates show that 21 percent of young urban graduates lived with a parent.
Employment
Rural and urban young graduates had similar employment patterns. Eighty-five percent were employed, 5 percent were unemployed and 10 percent were not in the labor force. There were, however, differences in the occupations in which rural and urban young graduates were employed. For example, 68 percent of young urban graduates were employed in management and professional occupations compared to 62 percent of young rural graduates. Twenty-one percent of young rural graduates were in office and sales occupations compared to 18 percent of young urban graduates.
The top three industries in which young rural graduates were employed were education (25 percent), health care (14 percent), and retail (9 percent). Among young urban graduates, the top three industries in which they were employed were education (21 percent), professional services (16 percent), such as accounting, legal services and computer design, and health care (14 percent).
A higher percentage of young rural graduates worked part-time (less than 35 hours week) than young urban graduates (18 percent and 14 percent, respectively).
Fifty-eight percent of young rural graduates were employed by private companies; 17 percent were employed by nonprofit organizations; 22 percent were employed by government agencies (including school districts); and 3 percent were self-employed. Among young urban graduates, 66 percent were employed by private companies; 18 percent were employed by nonprofit organizations; 13 percent were employed by government agencies; and 3 percent were self-employed.
Income
The median income for young rural graduates who worked full-time and year-round was $40,729. There was an $8,146 income gap between young rural male and young rural female graduates who worked full-time and year-round. The average rural male graduate had a median earning of $45,821, while the average rural female graduate had a median earning of $37,675.
Young urban graduates who worked full-time and year-round had a median income of $45,821 per year, or nearly $5,100 more than their rural counterparts. There was an $8,146 income gap between urban male and urban female graduates as well. The average urban male graduate who worked full-time and year-round had a median earning of $50,912, while the average urban female graduate had a median earning of $42,766.
Poverty and Health Insurance
The poverty rate among rural and urban young graduates was 6 percent and 8 percent, respectively.
Approximately 8 percent of rural and urban young graduates did not have health insurance coverage.
Housing
Fifty-nine percent of young rural graduates were homeowners and 41 percent were renters. Forty-six percent of young urban graduates were homeowners and 54 percent were renters.
The average housing value of a young rural graduate who owned a home was $150,000. Monthly costs (mortgage, utilities, insurance and the like) were $1,200, or 19 percent of their household income. Among renters, the median gross rent was $750, or approximately 23 of their household income.
The average housing value of a young urban graduate who owned a home was $200,000. Monthly costs were $1,538, or 22 percent of their household income. Among renters, the median gross rent was $980, or approximately 23 percent of their household income.
A high percentage of both young rural and urban graduates (77 percent and 83 percent, respectively) moved within the past 5 years.
Young Grads in Other States
Twenty-eight percent of young adults nationwide earned a bachelor’s degree or higher. The three states with the highest percentages of young adults with a bachelor’s degree or higher were Massachusetts (42 percent), New York (37 percent), and New Jersey (37 percent). The three states with the lowest percentages were Nevada, New Mexico, and Mississippi, each with less than 19 percent of young adult graduates. Pennsylvania had the nation’s 12th highest percentage of young adults with a bachelor’s degree or higher (32 percent).
Rural and Urban Young Graduates (21 to 34 Years Old) by Bachelor's Degree Category, 2011

Pennsylvania Results Now Available from National Survey of Anglers, Hunters and Wildlife Watchers
In 2011, the U.S. Fish and Wildlife Service and U.S. Census Bureau conducted a survey of U.S. residents about their fishing, hunting and wildlife watching activities.
The survey found that 4.6 million Pennsylvania residents and non-residents (16 years and older) fished, hunted or wildlife watched in Pennsylvania.
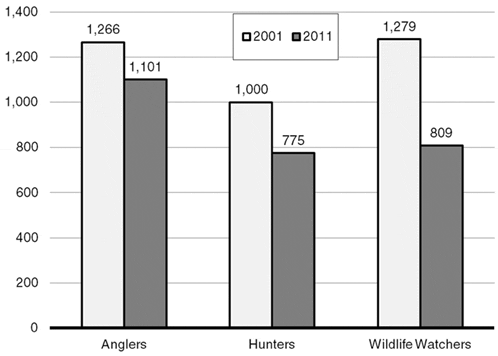
Of the total number, 1.1 million fished, 775,000 hunted and 809,000 observed, fed and/or photographed wildlife away from home. Another 3.2 million observed, fed and/or photographed wildlife around the home.
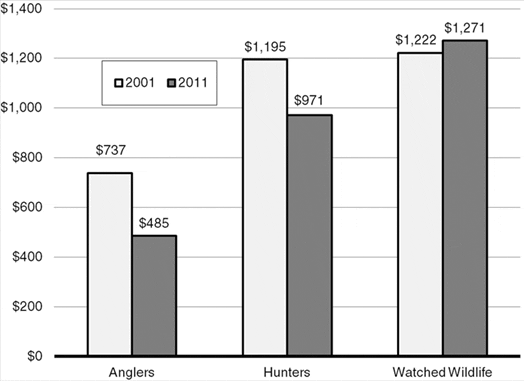
The graphs at left compare the findings of the 2011 survey with a similar survey conducted in 2001.
From 2001 to 2011, the number of anglers, hunters and away-from-home wildlife watchers decreased 13 percent, 23 percent and 37 percent, respectively.
In-state expenditure from 2001 to 2011 decreased among anglers and hunters by 34 percent and 19 percent, respectively, but increased among wildlife watchers by 4 percent.
More results from the 2011 National Survey of Fishing, Hunting and Wildlife-Associated Recreation and the Pennsylvania-specific results are available at http://www.census.gov/prod/www/fishing.html.
Number of People Who Fished, Hunted, and Watched Wildlife Away from Home, 2001, 2011 (In Thousands)

Total Expenditures by Angler, Hunter, and Wildlife Watching Participants in Pennsylvania (In Millions of 2011 Dollars)

Just the Facts: Substantiated Cases of Elder Abuse
Data from the Pennsylvania Department of Aging indicate that, in 2010-2011, there were 4,355 substantiated cases of elder abuse, 30 percent of which were in rural counties and 70 percent in urban counties.
According to the Department of Aging, an abuse case is substantiated when protective services is called in to intervene.
In rural counties in 2010-2011, there were 1,300 substantiated cases or 160 cases for every 100,000 people age 60 or older. In 2008-2009, there were 858 substantiated cases or 111 cases for every 100,000 people age 60 or older.
In urban counties in 2010-2011, there were 3,055 substantiated cases or 156 cases for every 100,000 people age 60 or older. In 2008-2009, there were 2,182 substantiated cases or 117 cases for every 100,000 people age 60 or older.
A 2011 Government Accounting Office (GAO) report analyzed elder abuse data from 2009 for 27 states including Pennsylvania. The report found that the substantiated rate among these states was 253 cases of elder abuse for every 100,000 seniors.
The three states with the highest rates were Texas, Montana, and Virginia, each with a rate higher than 390 cases for every 100,000 seniors.
The three states with the lowest rates of elder abuse were Hawaii, Minnesota, and Utah, each with a rate lower than 45 substantiated cases for every 100,000 seniors.
Among all 27 states studied, Pennsylvania had the 18th highest per capita number of substantiated cases.
