Newsletters
- Home
- Publications
- Newsletter Archive
- Newsletter
July/August 2006
Inside This Issue:
- A Home of My Own: Rural Pennsylvania’s Affordable Housing Stock
- Issues Affecting Rural Water Systems
- Chairman’s Message
- North, South, East and West: Rural Is All Over the Map in Pennsylvania
- Behind the Numbers: Rural
- Enjoy Farm Watching? This Guide Is for You
- Hammer in Hand: Data on Residential Building Permits Issued in Rural Counties
- Just the Facts: SAT Scores and Other School Data
- Farm Bill Hearing Set for July 21 in Harrisburg
A Home of My Own: Rural Pennsylvania’s Affordable Housing Stock
Affordable, quality housing provides well-documented benefits to families, children, and the community at large. Recent research, sponsored by the Center for Rural Pennsylvania, however, points to a shortage of affordable housing across rural Pennsylvania that varies by region and even from county to county.
Dr. Rajen Mookerjee of Penn State University–Beaver and Drs. Angela M. Williams Foster and David Y. Miller of the University of Pittsburgh conducted the research in 2004 to determine the availability of quality affordable housing across Pennsylvania’s rural counties.
To complete the project, the researchers estimated the demand and supply of affordable housing in each rural county, conducted telephone surveys of various housing agencies and other stakeholders in the affordable housing arena and conducted case studies of six rural counties, each with a unique set of factors affecting housing dynamics. The combination of these methods provided a rich analysis of affordable housing in rural Pennsylvania.
Findings
According to the widely accepted definition of affordable housing, many rural Pennsylvanians cannot afford decent housing, resulting in a large percentage of households, especially renters, paying more than 30 percent of their income for housing costs. Some wealthier households pay this much by choice, but in households with incomes under $20,000, this can be a major problem.
The affordable housing supply and demand estimates in the study present the number of low-income households and the number of rental units affordable to households within specific income ranges. Since estimates use conservative adjustments for housing quality, the actual supply of affordable housing is likely much lower than those shown in the table below.
Affordable Rental Housing Supply and Demand, 2000 Estimates

Area Median Income (AMI) refers to annual estimates of median household income from the U.S. Department of Housing and Urban Development.
And while the research points to an estimated surplus of affordable housing for low-income households in rural Pennsylvania overall, it also revealed that some rural Pennsylvania counties face a severe shortage of affordable housing for certain low-income groups.
Furthermore, estimates of affordable housing supply and demand do not adequately reflect the need for affordable housing because, while affordable housing units may exist, low-income households may not have access to them. Limited access may result from higher income households occupying these units, inadequate information about the units, lack of transportation to prime housing, insufficient numbers of units with enough bedrooms, or a myriad of other reasons.
Conclusions
Based on their quantitative statistics and qualitative conversations with stakeholders, the researchers offered the following considerations to address the provision of quality, affordable housing for all rural Pennsylvanians.
- Establish an information clearinghouse for housing authorities that includes state and federal funding information, best practices and other initiatives.
- Reduce the paperwork burden for funding and program participation.
- Increase the emphasis on enforcing fair housing laws to ensure adequate quality housing for the growing rural minority population.
- Increase funding for: the establishment and expansion of transitional rural homeless shelters; rehabilitation and new construction; infrastructure development to lower the cost of land for construction of affordable housing; and public transportation in rural areas so more people can get to higher paying jobs and afford quality housing without public cost.
- Begin an interstate dialogue about the provision of affordable housing in border regions.
- Produce a collaborative, comprehensive statewide housing plan involving state agencies and local rural housing agencies.
Full Report Available
For a copy of the full report, Affordable Housing in Rural Pennsylvania, call or email the Center at (717) 787-9555 or info@ruralpa.org. A copy of the report is also available online at www.ruralpa.org/reports.html.
Issues Affecting Rural Water Systems
Like other communities across the commonwealth, Pennsylvania’s small, rural communities must have healthy water and wastewater systems to accommodate their residents. And like other communities, rural communities are being challenged by a host of issues that can threaten their water and wastewater systems.
To identify issues affecting Pennsylvania’s small public water and wastewater systems, the Center for Rural Pennsylvania sponsored research to examine the system capacity of a sample of Pennsylvania’s small water systems. The study, conducted by Dr. Beverly Cigler of Penn State Harrisburg, also assessed the systems’ abilities to meet a variety of challenges that are facing today’s water and wastewater operations.
For the study, conducted from 2002 to 2004, the researcher interviewed plant operators for rural Pennsylvania’s public or community water and wastewater infrastructure systems by telephone to provide a baseline assessment of each system’s capacity. The baseline data will help to lay a foundation for public and private actions needed to meet the challenges for funding Pennsylvania’s rural water and wastewater infrastructure in the coming decades.
This study examined only systems that serve very small, small, or medium populations, which totaled 2,604 facilities. A random sample of 180 systems was selected with 30 systems in each of the size and system categories. Seventy-three percent of the 90 selected water systems and 59 percent of the 90 selected wastewater systems participated in the study for a 58 percent response rate.
Findings and conclusions
Following are some of the study’s findings and conclusions:
1. Enhance operator skills. The research found that costs for infrastructure may be reduced by enhancing the managerial, technical and financial skills of those responsible for the operation of water and wastewater systems.
2. Plan for the future. Cooperation among and between local governments, state and federal regulatory agencies, funding agencies, and legislators is needed to address the present and future needs of the state’s small water and wastewater systems.
3. Improve data collection. The collection of systematic information on community infrastructure systems is strategically significant; without it, it is difficult to plan for future repairs, upgrades, and replacements.
4. Improve information flow. Adequate funds to meet present and future community needs must be obtained. Without external funding assistance, some small communities cannot move into a proactive planning mode to deal with future needs.
5. Provide training. More attention needs to be devoted to evaluating and possibly integrating technical training opportunities for plant operators and to providing financial management training for plant operators and board members. The research also highlighted the need to train system operators on how to educate community residents about the costs of infrastructure.
6. Consider alternative strategies for capacity building. Alternative strategies for communities of various sizes should be considered to develop capacity-building activities, especially financial capacity, since communities of various sizes often face different challenges.
7. Plan for capital improvements. If addressing future infrastructure is a goal, capital improvement planning assistance should be provided to communities of all sizes.
Report Now Available
For a copy of the report, Rural Pennsylvania’s Water and Wastewater Infrastructure, call or email the Center at (717) 787-9555 or info@ruralpa.org. The report is also available online at www.ruralpa.org/reports.html.
Chairman’s Message
While some people may dream of having the perfect home – a kitchen with all the latest appliances, the oversized garage for all the toys and tools, and the walk-in closets to hold all our clothes – most of us consider our home, regardless of its size or accommodations, as our castle.
More importantly, whether owning a home or renting an apartment, our homes are meeting a basic human need. According to Abraham Maslow’s five-stage Hierarchy of Human Needs, shelter is as basic a need as the air we breathe, the water we drink and the food we eat.
To determine the degree to which affordable, quality housing is available to rural Pennsylvanians, the Center sponsored research in 2004 and the final report is now available. Highlights of that report serve as the feature article in this edition of Rural Perspectives.
Dr. Rajan Mookerjee of Penn State University – Beaver conducted the study and Drs. Angela M. Williams Foster and David Y. Miller of the University of Pittsburgh served on the research team.
When looking at the numbers alone, it appears that most rural Pennsylvanians are fulfilling that basic need of obtaining shelter. According to the 2000 Census, 75.4 percent of all rural households are owner occupied, a slight increase over a 1990 Census figure of 75.3 percent.
But how affordable is that housing for homeowners and for the one in four households that rent? And has household income increased sufficiently to meet the increases in housing costs? These questions were among those addressed in the research and the findings present some challenges to consider.
From 1990 to 2000, housing costs in owner-occupied units increased, while for all regions, except southwestern Pennsylvania, household income did not rise as much. In fact, 55 percent of homeowners who earn less than $20,000 a year are paying more than 30 percent of their income on housing, and 79 percent of renters who earn less than $20,000 a year are paying more than 30 percent of their income on housing. For those earning between $20,000 and $34,999, 29 percent of both homeowners and renters are paying more than 30 percent of their income on housing.
Studies have shown that homeownership is often the greatest means one has to obtain personal wealth. To help more people achieve that goal, government – at both the federal and state levels – offers numerous resources and funding. And since homeownership may not be a viable option for everyone, there are also programs to help others obtain affordable rental housing. While these programs are in place, our work to help people achieve homeownership or to obtain decent, affordable housing is not done.
We are challenged to monitor and review those federal and state efforts to see if the intended outcomes are being achieved and how well they are working.
I am pleased the Center for Rural Pennsylvania is contributing to the knowledge base and a better understanding of affordable, quality housing in the Commonwealth’s rural communities.
Senator John Gordner
North, South, East and West: Rural Is All Over the Map in Pennsylvania
Within Pennsylvania's 44,820 square miles of land, there are 48 rural counties, 243 rural school districts and 1,655 rural municipalities. That’s according to the Center for Rural Pennsylvania’s definition of rural.
County, school district definition
The Center’s definition of rural is based on population density, or the number of persons per square land mile. Since the statewide population density is 274 persons per square land mile, the Center considers a county or a school district to be rural when the population density within the county or school district is less than 274 persons per square land mile.
In 2000, 3.4 million residents, or 28 percent of the state’s 12.3 million residents, lived in a rural county.
During the 2004-2005 school year, more than 505,000 public school students, equaling 29 percent of the state’s 1.7 million public school students, attended schools in rural districts.
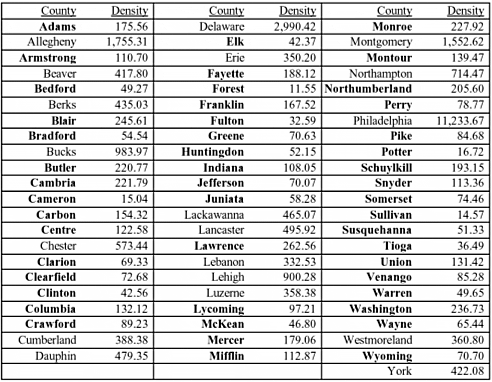
The table below lists Pennsylvania’s 67 counties and highlights the state's 48 rural counties in bold.

Municipal definition
For a municipality to be considered rural, the population density should be less than 274 persons per square land mile or the total population should be less than 2,500 people unless more than 50 percent of the population lives in an urbanized area, as defined by the U.S. Census Bureau.
In 2000, more than 2.8 million people, or 24 percent of the state’s population, lived in a rural municipality.
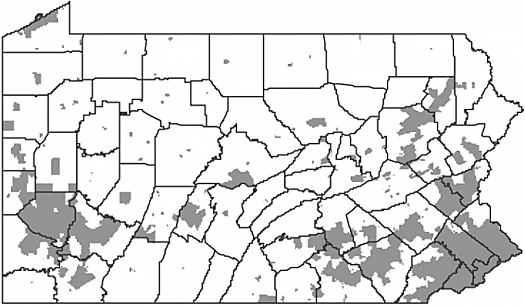
In the map below, rural municipalities are shown in white.

A slight difference in numbers
Why are there more rural county residents than rural municipal residents?
At the county level, when the county is considered rural, then all of the residents in the county are considered rural. The county definition includes every resident living in every municipality, both rural and urban, in the county.
The municipal definition, however, only includes those residents who live in a rural municipality, regardless of whether the county is considered rural or urban. Using the Center’s definition, it is possible to have an urban municipality in a rural county and a rural municipality in an urban county.
Behind the Numbers: Rural
What’s rural?
For the average person, rural is a subjective concept that conjures up images of small towns, farmlands and forests. For others, rural is an objective, quantitative measure that is clearly defined.
How is rural defined?
There is no single definition of rural. However, many definitions tend to identify rural areas as having low population densities and unique economic and social conditions. Historically, federal and state agencies have developed their own definitions or have used other agencies’ definitions of rural to meet program needs and to describe different populations. For example, most definitions start with population density as a foundation, and add other factors, such as commuting patterns or total population, to fit specific needs.
What are the typical elements used to define rural?
Many rural definitions include two common elements: the measurement of spatial areas and the measurement of that area’s population and its characteristics.
Why is it important to define rural?
Having a measure of rurality tells us that there are differences in population and that distance, population density, and isolation impact the character of the populations that live in these areas.
How can I get more information?
For a more detailed fact sheet, Behind the Numbers: Rural, visit the Center for Rural Pennsylvania’s website at www.ruralpa.org/fact_sheets.html, call (717) 787-9555 or email info@ruralpa.org.
Enjoy Farm Watching? This Guide Is for You
Penn State Cooperative Extension has released a roadside guide to help non-farmers better understand and appreciate the types of agricultural activities they may encounter in Pennsylvania. The Joy of Farm Watching: A Roadside Guide to Pennsylvania Agriculture provides a short overview of each of the major farm types in Pennsylvania and includes a description of their production activities and maps that show the counties where the different types of farms typically exist. The guide is available from Penn State University’s College of Agricultural Science’s Publication Distribution Center at (814) 865-6713 or AgPubsDist@psu.edu. Single copies are free and multiple copies sold in bulk cost $1 per copy. For more information about the guide or a PDF version, visit www.farmwatching.psu.edu.
Hammer in Hand: Data on Residential Building Permits Issued in Rural Counties
One indicator of growth and development in a county is the number of residential building permits issued. Census 2000 data show that rural Pennsylvania had more than 1.5 million housing units. Between 2000 and 2005, nearly 84,500 new homes were built, according to building permit data from the Census Bureau. This represents a 5.5 percent growth in housing. In urban areas, housing experienced a 5 percent growth.
Home building increased the number of units by more than 10 percent in six counties. Of those six counties, all bordered other states, and four were rural counties. Regionally, home building grew the fastest in south central Pennsylvania, followed by the northeast. In the other regions, home building was completed at a slower rate than the state as a whole (See tables below).

It is interesting to note that over the same time period of 2000 to 2005, rural Pennsylvania gained an estimated 45,000 people, for a population growth rate of 1.3 percent. These figures show that about 19 new housing units were built in rural Pennsylvania for each 10 additional residents.
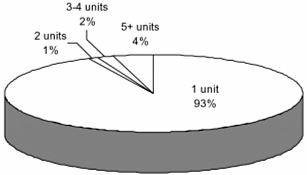
In rural counties, 93 percent of the residential building permits in 2005 were for one-unit buildings. About 4 percent were for buildings of five or more units and the remaining 3 percent were for buildings with two to four units. These percentages are quite different in urban counties where 80 percent of residential building permits were for single unit buildings and 17 percent were for buildings of five or more units.
New Residential Housing Units by Number of Units in Building, 2005

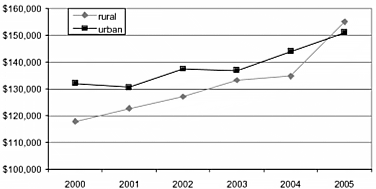
The total value of new housing units in rural Pennsylvania in 2005 was more than $2 billion. The value of all units built from 2000 to 2005 was nearly $11.2 billion (inflation adjusted to 2005 dollars). This translates to an average of $131,871 per unit. The average cost per unit in 2005 was $154,988, while in 2000 it was $117,759, an increase of almost 32 percent in five years.
Average Cost per New Rural and Urban Residential Housing Unit, 2000-2005
(Inflation adjusted to 2005 dollars)

Just the Facts: SAT Scores and Other School Data
According to recent data from the Pennsylvania Department of Education and the U.S. Census Bureau, students attending public schools in urban areas might be better prepared for college than those attending rural school districts.
An assessment of SAT data on all public schools showed rural schools to consistently fall behind their urban counterparts in student SAT output. The SAT Reasoning Test (formerly known as the Scholastic Aptitude Test) is the standardized achievement test used by many colleges and universities to evaluate applicants’ potential for academic achievement.
Because so many high school students take the test nationwide each year, it has become a widely used comparison tool. In comparing the SAT data of students in rural areas of Pennsylvania to students in urban areas, some slight discrepancies were apparent. From 2003 to 2005, the average total SAT score for students in rural Pennsylvania was 992, while urban students averaged 1,006. During the same period, 28 percent of 11th and 12th graders in rural school districts took the exam, compared to 32 percent of urban students in the same grades. The average math and verbal scores were 495 and 497, respectively, for rural students, while urban test-takers averaged 499 and 507, respectively. Moreover, the statewide composite SAT score of 1,003 ranked noticeably low on the national scale in 2004, with Pennsylvania ranking 44 out of the 50 states and Washington, DC.
Additionally, the Pennsylvania Department of Education reports that the Pennsylvania System of School Assessment (PSSA) results were lower for high school juniors in rural areas of the state, with an average of 24 percent scoring advanced proficiency in math and 34 percent achieving advanced proficiency in reading, as compared to juniors in urban districts who averaged 29 and 35 percent, respectively.
In terms of postsecondary education enrollment goals, 71 percent of students in rural areas chose to continue their education after high school in 2003, whereas 79 percent of urban grads opted to continue their education.
The U.S. Census Bureau reported in 2000 that 14 percent of adults in rural areas had a bachelor’s degree or higher, while 25 percent of adults in urban areas had a bachelor’s degree or higher.
Farm Bill Hearing Set for July 21 in Harrisburg
The U.S. Senate Agriculture, Nutrition and Forestry Committee will hold a regional hearing on the 2007 Farm Bill in the VIP Room of the State Farm Show Complex, Harrisburg, on July 21, 2006, beginning at 1 p.m. The witness list will be limited to farmers.
Others interested in speaking should contact U.S. Senator Rick Santorum. For a local telephone number, check your local telephone directory or visit http://santorum.senate.gov.
For more information about the hearing, visit the Agriculture, Nutrition and Forestry Committee’s website at http://agriculture.senate.gov/ag/fb.htm.
For general information, contact Mike Pechart, policy director, Pennsylvania Department of Agriculture at (717) 705-2122.
