Newsletters
- Home
- Publications
- Newsletter Archive
- Newsletter
May/June 2015
Inside This Issue:
- Research Explores Career Satisfaction, Future Plans of Rural Health Care Workforce
- Chairman's Message
- Rural Snapshot: Municipal Pension Plans
- Fast Fact: Income Inequality in Pennsylvania
- Did You Know . . .
- Just the Facts: Look Twice, Save a Life
Research Explores Career Satisfaction, Future Plans of Rural Health Care Workforce
It’s no secret there are health care worker shortages in rural Pennsylvania. According to the U.S. Department of Health and Human Services, 30 of Pennsylvania’s 67 counties include geographic areas designated as Health Professional Shortage Areas (HPSAs). Of the 30 HPSAs, 26 are located in rural Pennsylvania.
The results of recent research sponsored by the Center for Rural Pennsylvania suggest there are a number of factors, such as health care worker job dissatisfaction and potential retirement, which could intensify these shortages in the future.
Research background
Dr. Brandon Vick, Margaret Gagel and Dr. David Yerger of Indiana University of Pennsylvania analyzed survey data on four health workforces in Pennsylvania, namely physicians, physician assistants, dentists, and dental hygienists, to identify any rural/urban differences in the workforce makeup, career satisfaction, and plans to leave patient care. The research was conducted in 2014 and the data for the analysis came from the 2012 and 2013 Pennsylvania Health Workforce Surveys, which are from the Pennsylvania Department of Health’s Bureau of Health Planning.
Findings
According to the research, the number of rural physicians and dentists nearing retirement age is larger than the number of physicians and dentists early in their careers. In rural areas, physicians and dentists who are 30 to 39 years old make up a smaller percentage of their workforces than those in urban areas.
In rural areas, most physician assistants and dental hygienists are younger than 45 years old. The age distribution of these professionals is similar in urban areas.
Only 24 percent of all rural physicians are female, 39 percent of whom are age 40 and younger. However, a much larger percentage of younger urban physicians are female (47 percent), suggesting that there may be barriers or preferences that sway females from practicing in rural areas. While females make up a smaller percentage of dentists overall (21 percent), the results suggest stronger female representation among dentists beginning their careers (45 percent) in both rural and urban settings.
Overall, 14 percent of physicians reported dissatisfaction with their careers in the past year, with slightly more rural physicians reporting dissatisfaction.
After controlling for other factors, the research indicated that rural physicians have 17 percent higher odds of reporting dissatisfaction, which is important given the strong links between career satisfaction and decisions to leave practice.
Rural physician assistants, dentists, and dental hygienists nearing retirement age also have higher odds of retiring in the next 6 years than their urban counterparts.
As the research could not determine why rural health care workers report dissatisfaction and plans to leave their professions, the researchers recommend future research to focus on a number of areas, including: qualitative studies to help uncover the reasons for higher rural dissatisfaction and plans to leave patient care, as well as reasons why female and younger physicians and dentists are underrepresented in rural areas; county-level studies to identify specific factors that drive rural/urban differences identified in this research; and studies into what fraction of the health care workforce is equipped to provide services for veteran and elderly patient populations and the potential barriers that may exist to meeting the growing demand from these populations.
For a copy of the research results, Assessing Career Dissatisfaction and Plans to Leave Patient Care Among the Rural Health Workforce, visit www.rural.palegislature.us or call (717) 787-9555.
Pennsylvania's Rural Population and Rural Health Workforces Studied
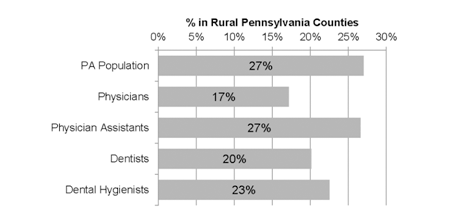
Source: Researchers' calculations, Health Workforce Surveys, 2012, 2013. Pennsylvania population information from the Center for Rural Pennsylvania (2014). Note: Analysis of 26,544 physicians, 4,568 physician assistants, 5,187 dentists, and 5,570 dental hygienists. Health workforces consist of those in direct patient care at the time of the survey.
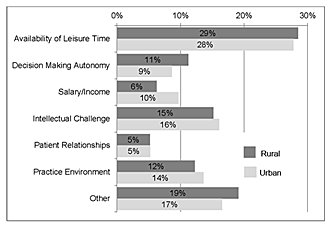
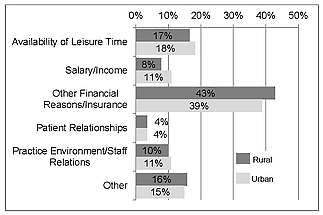
Sources of Professional Dissatisfaction Among Rural and Urban Physicians and Dentists
Physicians
|
Dentists
|
Source: Researchers’ calculations, Health Workforce Surveys, 2012, 2013. Note: Analysis of 26,544 physicians, and 5,187 dentists. “Other” category represents the respondents who chose “Other” as their primary source on the survey questionnaire.
Chairman's Message
A number of studies have called attention to the growing need for health care professionals, especially primary care physicians, in Pennsylvania in the near future.
For rural Pennsylvania, health care professional shortages are nothing new. In fact, research sponsored by the Center for Rural Pennsylvania and conducted by Mansfield University in the early 1990s documented Health Professional Shortage and Medically Underserved Areas in Pennsylvania. The federal Department of Health and Human Services officially approved these designations following the release of that research, and these designations helped rural areas get access to more health care professionals through loan forgiveness programs.
Over the years, however, rural areas still struggled with attracting and retaining health care professionals, and more recent research sponsored by the Center indicates that health care worker job dissatisfaction and potential retirement could intensify shortages in the future. The study, featured on Page 1, was conducted by researchers from Indiana University of Pennsylvania. It indicated that rural physicians and dentists who are nearing retirement age outnumber those who are early in their careers. The research also found that slightly more rural physicians than urban physicians are dissatisfied with their careers. This research supports other recently released studies that suggest policy and program changes that will increase the number of health care professionals, especially in rural areas.
On Pages 4 and 5, the Rural Snapshot takes an updated look at municipal pension plans. A 2013 study of Pennsylvania municipal pensions, sponsored by the Center and available at www.rural.palegislature.us, found that many of Pennsylvania’s rural communities are doing it right when it comes to their municipal pension obligations. The research suggested that rural pension plans should not be consolidated with urban pension plans, as other studies have suggested. It found that a one-size-fits-all consolidation would combine pension plans that are fully funded with others that have unfunded liabilities in excess of $6 billion. The Center’s study was not able to examine administrative costs and does not dispute other findings concerning such costs. However, it remains a significant point that those studies did not examine pension plans by a rural/urban designation, and raises questions about the real benefit of one consolidated municipal pension plan. Therefore, as I have indicated in the past, before any policy changes regarding municipal pension plan consolidations are made, systematic problems should first be identified and appropriately remedied. This can help to ensure that these changes actually address the problem and are fair and equitable for all municipalities.
Senator Gene Yaw
Rural Snapshot: Municipal Pension Plans
Defining Municipal Pension Plans in Pennsylvania
The data used for the Snapshot are from the Pennsylvania Public Employee Retirement Commission. According to the commission, municipal pension plans may be categorized as defined benefit or money purchase (defined contribution) pension plans.
In defined benefit pension plans, the pension benefit to be payable at retirement is fixed in some manner and a resultant actuarial liability is established and funded.
Defined benefit pension plans may be characterized as “fully-insured” or “self-insured.” In fully-insured pension plans, fund assets are allocated to individual members through insurance instruments prior to retirement and the insurance is sufficient to guarantee the pension benefits at retirement. Defined benefit pension plans characterized as self-insured are those plans where some or all of the risk of providing pension benefits remains with the municipality, even though the plan may have an insurance component. In some instances, defined benefit pension plans are provided by municipalities through participation in Taft- Hartley Act collectively bargained, jointly trusteed, multi-employer pension plans.
In money purchase (defined contribution) pension plans, the pension benefit is determined by the monies accumulated in the retiring employee’s account up to the time of retirement. Money purchase pension plans may be funded with defined contributions or less formal funding mechanisms, both of which allocate monies to individual member accounts prior to retirement.
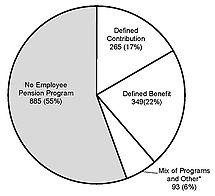
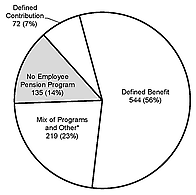
Rural and Urban Municipalities with Employee Pension Programs, 2013
Rural
|
Urban
|
Types of Municipal Pension Programs in Rural and Urban Municipalities, 2013
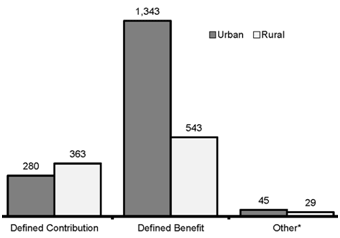
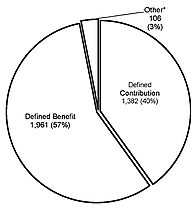
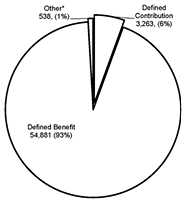
Number of Active Rural and Urban Members by Municipal Pension Type, 2013
Rural
|
Urban
|
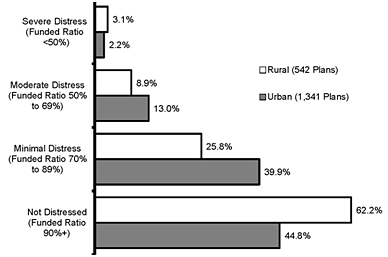
Funded Ratio for Defined Contribution Plans, 2013
Assets and Liabilities of Defined Benefit Programs by Active Members, 2013
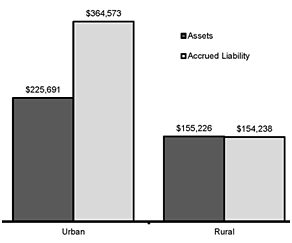
*Includes Taft-Hartley Act collectively bargained, jointly trusteed, multi-employer pension plan governed primarily by the federal Employee Retirement Income Security Act of 1974 (ERISA). Note: Data exclude programs for authority employees. Data source: Public Employee Retirement Commission.
Municipalities with Distressed Pension Programs, 2013
Note: Map does not show the 976 municipalities with pension programs that are not distressed (funded ratio of 90 percent or higher) nor the 1,020 municipalities with no pension programs.
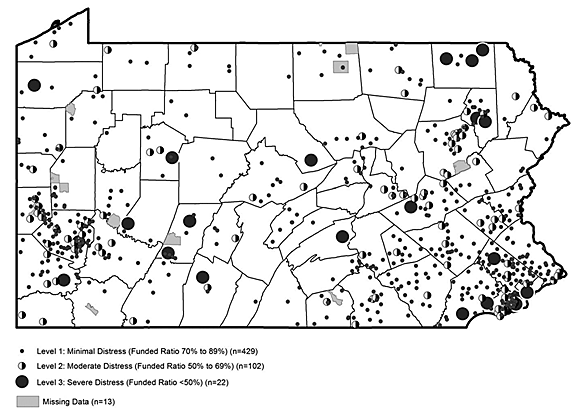
The Act 44 distress score is based on the aggregate funded ratio of a municipality's pension plan(s), as reported in the municipality's Act 205 Actuarial Valuation Report(s). The funded ratio is determined by dividing the total actuarial assets of the pension plans by the total actuarial liabilities, and stated as a percentage. If a municipality operates both defined benefit and defined contribution pension plans, all pension plans (including defined contribution plans) are used in the calculation of the total assets and liabilities. Data exclude programs for authority employees.
Fast Fact: Income Inequality in Pennsylvania
The Gini (pronounced jee-nee) index is often used to measure the degree of inequality in the distribution of household income. The index ranges from 0.0 to 1.0. A value closer to 0.0 indicates greater equality, and a value closer to 1.0 indicates greater inequality, so a county’s income distribution is nearly equal when its rate is closer to 0.0.
For example, in the map below, Forest County’s rate of 0.3867 indicates greater income equality within the county versus Philadelphia County’s rate of 0.5072.
Note that the index provides an overall look at income distribution within a county and does not necessarily indicate areas of high and low income.
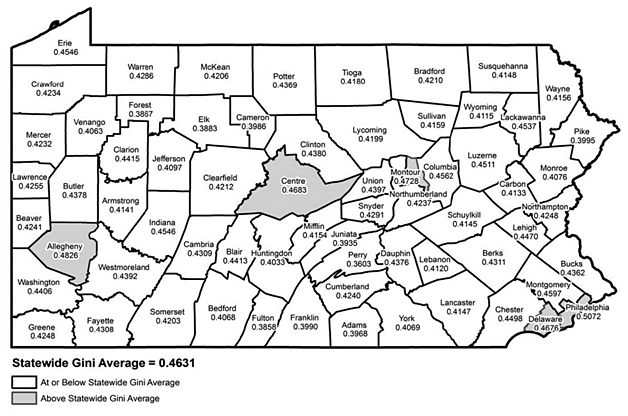
Data source: 2009-2013 American Community Survey, U.S. Census Bureau.
Did You Know . . .
14 percent of rural local elected municipal officials are female. (Governor’s Center for Local Government Services, July 2014)
21 percent of urban local elected municipal officials are female. (Governor’s Center for Local Government Services, July 2014)
$180.6 billion is the 2013 value of all taxable real property in rural Pennsylvania ($52,366 per capita). (Pennsylvania Tax Equalization Division)
$600.7 billion is the 2013 value of all taxable real property in urban Pennsylvania ($64,374 per capita). (Pennsylvania Tax Equalization Division)
Just the Facts: Look Twice, Save a Life
As the temperature rises, so do the number of motorcycles on Pennsylvania roadways.
According to data from the Pennsylvania Department of Transportation, from 2010 to 2014, there was a larger increase in registered motorcycles in rural counties than in urban counties. Rural counties had a 1 percent increase while urban counties had a 0.3 percent increase.
Despite the larger increase in registrations, motorcycles are only slightly more prevalent in rural Pennsylvania than in urban Pennsylvania.
In 2014, there were 4.2 motorcycles for every 100 vehicles in rural counties and 3.2 motorcycles for every 100 vehicles in urban counties.
The three counties with the largest increase in motorcycle registrations from 2010 to 2014 were Clinton, Fulton and Forest, each with an increase of more than 10 percent.
Not every county had increases during this period. Twenty-nine counties saw a decline in registered motorcycles. The three counties with the largest declines were Somerset, Wyoming and Lackawanna, each with a decline of 3 percent.
Nationwide, the number of motorcycles is on the rise. According to 2008-2011 data from the U.S. Department of Transportation, there was a 9 percent increase in registered motorcycles.
A 2014 membership survey of the American Motorcycle Association indicated that, on average, its members were 48 years old and had a riding experience of 26 years. Ninety-five percent of their members were male and 5 percent were female. On average, their members had household incomes of $85,300.

