Newsletters
- Home
- Publications
- Newsletter Archive
- Newsletter
May/June 2014
Inside This Issue:
- Characteristics of Pennsylvania Students Pursuing Postsecondary Education
- Chairman's Message
- Rural Snapshot: Rural Youth Education Study €“ Parental Influence
- Wage Gap Among Rural Females and Males
- That Message Can Wait: Texting While Driving Violations in PA
- Just the Facts: A License for Lucky
Characteristics of Pennsylvania Students Pursuing Postsecondary Education
Access to higher education, especially for low-income, minority and rural students, has been a concern among policymakers, education professionals and the general public. Combine this concern with Pennsylvania’s changing state demographics, and the recent recession and its influence on postsecondary enrollment, student aid applications, and student debt, and you have some very compelling reasons for a more current portrait of Pennsylvania’s postsecondary students and their financial needs.
To develop this picture, Dr. Esther Prins and Kimeka Campbell of Penn State University and Dr. Cathy Kassab analyzed 2010-11 data from the Free Application for Federal Student Aid (FAFSA), which included more than 610,000 applicants. With this data, the researchers developed socio-demographic, financial, and family profiles of rural and urban beginning and continuing postsecondary students. Beginning students were those who had not yet begun their postsecondary education, and continuing students were those who had already begun their postsecondary education.
The researchers also conducted interviews with financial aid administrators at six institutions in rural counties and with two higher education finance policy experts.
The research was sponsored by the Center for Rural Pennsylvania.
Student characteristics
According to the research, 20 percent of FAFSA applicants were from rural counties and 80 percent were from urban counties. Fifty-nine percent of all applicants were women, and the average age among applicants was 24. More than 40 percent of applicants were in or near poverty.
According to the research findings, rural and urban students were pursuing similar degrees. About 60 percent of students were pursuing a bachelor’s (BA/BS) degree, 27 to 28 percent were pursuing an associate degree, and 12 to 14 percent were pursuing a certificate, diploma, teaching credential, or other degree of less than 2 years. Rural students were more likely than urban students to: enroll in public 4-year institutions rather than private 4-year institutions or community colleges; enroll full-time: be younger; be beginning students; and be financially dependent on their parents.
Beginning vs. continuing students
Overall, beginning rural and urban students were in more precarious situations than continuing students. Compared to continuing rural students, beginning rural students were significantly less likely to pursue a BA/BS and more likely to pursue an associate degree or certificate/diploma (ACD) of less than 2 years. Beginning rural students also were more likely to: attend a technical school; enroll full-time; have a GED diploma; be the only household member in college; be male; and be single. Beginning rural students were less likely to: be adult learners; support a child dependent; and have a college-educated parent. Beginning rural students also had nearly $3,000 less income and lower expected family contributions for their education; were less likely to be financially independent; and were more likely to be in poverty and to live in a dislocated worker household than continuing rural students.
The differences among beginning and continuing urban students were similar to those of rural students, but with a smaller gap in income and expected family contributions.
Degree type
The research also uncovered stark differences between BA/BS and ACD students. ACD students were more likely to be adult learners and female, to have a GED diploma and less-educated parents, to live in a dislocated worker household, to support dependents, and to be in or near poverty.
Rural BA/BS students were more likely than urban BA/BS students to attend public 4-year institutions and to have lower incomes. However, inequalities between rural BA/BS and ACD students were not as pronounced.
Urban BA/BS students had the highest average income and were the most likely to attend private colleges.
GED recipients and adult learners
GED recipients and adult learners comprised about 8 percent and 35 percent of all applicants, respectively. They were more disadvantaged than high school graduates and traditional students on all measures. Typically, they were beginning or 1st year/continuing students, and first-generation students (more so for rural applicants) pursuing an associate degree or certificate/diploma. Adult learners and GED graduates had far greater financial need than their traditional-age and high school diploma peers, but this gap was greatest for urban students and for GED versus high school graduates.
Interview findings
The interview findings revealed that students’ and families’ financial need and loan debt have increased as income has declined, tuition and cost of living have increased, and federal, state, and institutional aid have not kept pace.
In response to growing financial need, some institutions have awarded more institutional aid or helped students to apply for private scholarships. Smaller institutions have also tailored financial aid awards and counseling to individual circumstances.
Rural students were perceived to have less geographic access to higher education, to have greater transportation or relocation costs, and to be predominately first-generation students.
Four institutions reported increased adult learner enrollment. According to the interviews, these adults have different economic situations and required different financial aid than traditional students.
Policy considerations
Overall, the research found that FAFSA applicants had high levels of financial need. The findings from the interviews indicated that, to alleviate these needs and to increase college affordability, policymakers should consider increasing appropriations for state grants and public postsecondary institutions. This is especially crucial for rural students, who, this study shows, were more likely to attend public 4-year universities.
Additional policy implications included expanding state aid for students pursuing a degree of less than 2 years; offering state grants to distance learners (Act 59 of 2013 established a pilot program to offer state grants to distance learners); extending state grant deadlines for first-time and non-renewal adult learners; establishing state grant reciprocity agreements with neighboring states; and exploring state tax incentives for higher education tuition.
Report available online
For a copy of the report, Financial Needs and Characteristics of Students Pursuing Postsecondary Education in Pennsylvania: A Rural-Urban Analysis, visit the Center’s website at www.rural.palegislature.us.
Chairman's Message
This issue of Rural Perspectives highlights some challenges that our entire commonwealth is facing; namely, the increasing costs of postsecondary education and the loss of our youth.
Our feature article highlights the work of Penn State researchers who analyzed data from more than 600,000 federal student aid applications and conducted interviews with financial aid administrators from six Pennsylvania colleges and universities. The research goal was to analyze the make-up and status of Pennsylvania’s postsecondary students and their financial needs.
According to the research results, 60 percent of students, both urban and rural, were pursuing a bachelor’s degree, approximately 28 percent were working toward an associate degree, and just over 12 percent were pursuing a certificate, diploma or degree of less than 2 years. The research indicated that adult learners and GED graduates have far greater financial need than their traditional-age and high-school-diploma peers. It also noted that loan debt has increased, as well as tuition and the cost of living, while household incomes have declined.
The research also indicated that some rural students are challenged by less geographic access to higher education, thus incurring increased expenses for transportation or relocation.
The researchers offered several insightful policy implications in regard to the research results, which are available on the Center’s website.
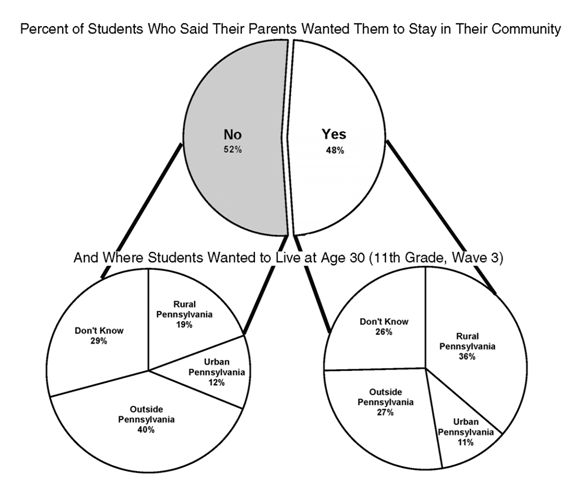
In Rural Snapshot, on Page 4, we continue sharing the results of our longitudinal study, where researchers surveyed rural youth over a period of several years about their career, educational and residential goals. The survey results indicated that parents have a strong influence on their children regarding their educational pursuits. When it comes to future residential plans, the majority of survey participants said their parents did not want them to stay in their community. It’s understandable why some parents may be encouraging their children to experience life in other communities, as they recognize that opportunities, both educational and career-wise, can be limited in rural areas. However, it’s also interesting to note that, among the students who said their parents wanted them to remain in their community, a plurality indicated they wanted to live in rural Pennsylvania at age 30. Perhaps they recognize the quality of life that small communities offer, particularly when raising a family.
These results certainly provide all of us with a better understanding of our youth, and, perhaps more importantly, an opportunity to show them how vital they are to the future of our communities as civic leaders, entrepreneurs and engaged citizens.
Senator Gene Yaw
Rural Snapshot: Rural Youth Education Study €“ Parental Influence
The Center for Rural Pennsylvania contracted with Pennsylvania State University researchers in 2004 to begin a longitudinal study of rural Pennsylvania school students to understand their educational, career and residential goals and the factors influencing these goals.
The Rural Youth Education Study followed two groups of youth from 11 rural Pennsylvania school districts. The study collected data every other year for four waves beginning in 2005.
At the beginning of the study, the younger group was in 7th grade and the older group was in 11th grade. By the final wave, the younger group was 1 year out of high school and the older group was 5 years out of high school.
This installment of Rural Snapshot centers on the responses from the younger group of students, who were in 7th grade during Wave 1 and in 11th grade during Wave 3, about the influence of their parents and others on their educational, career and residential goals.
Researchers who want access to the data for further analysis should call or email Jonathan Johnson at (717) 787-9555 or johnsonj@rural.palegislature.us.
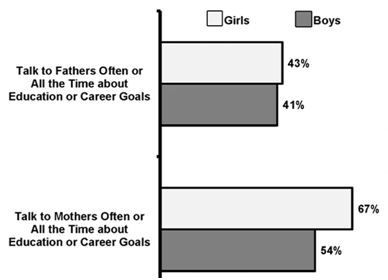
Percent of Students Who Talk To Their Parents Often or All the Time About Educational or Career Goals (11th Grade, Wave 3)
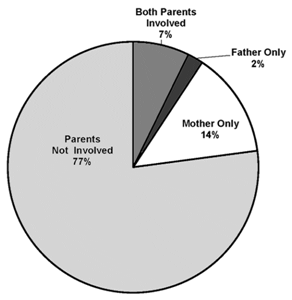
Parents Involved in Classroom Activities and/or Parent-Teacher Organizations (11th Grade, Wave 3) (Excludes don't know answers)
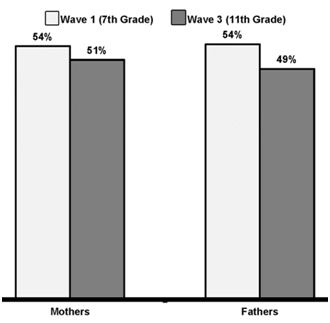
Percent of Students Who Said Their Mothers, Fathers Would Be Very Disappointed If Students Did Not Graduate College, Waves 1 and 3
Person(s) Students Talk to Often or All the Time About Where They Hope to Live as an Adult (11th Grade, Wave 3)
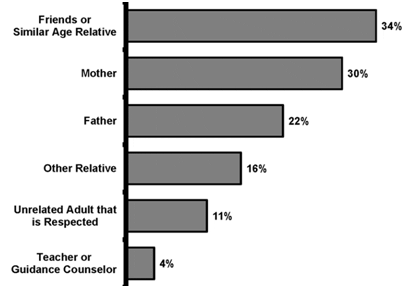
Note: totals do not equal 100 percent due to multiple responses.
Wage Gap Among Rural Females and Males
Rural women earn significantly less than rural men, according to an analysis of the U.S. Census Bureau’s 2012 American Community Survey, Public Use Microdata Sample. The analysis of median wages showed an $11,920 wage gap between adult females and males (18+ years old) who were employed full-time (35+ hours per week) and year-round (50+ weeks per year). The median income for females was $33,539, while the median income for males was $45,459.
The earning gap widened as educational attainment increased. Females, with a high school diploma only, earned $10,102 less than males, with a high school diploma only. Females with a bachelor’s degree or higher earned $16,769 less than males with a bachelor’s degree or higher.
There was an equally sizable gap in median wages by sector. Females working in the private sector earned $11,920 less than their male counterparts. In the nonprofit sector, females earned $14,648 less than males, and among government workers, females earned $8,081 less than males.
According to the analysis, the gap persisted among various age groups. There was a $7,100 wage gap between females and males who were younger than 35 and who were 65 years old and older. The gap among females and males age 35 to 64 was even greater at $15,153.
The gender wage gap is not unique to Pennsylvania’s rural areas. In 2012, urban females earned $10,102 less than urban males. And like the wage gap between rural females and males, the gap between urban females and males persisted regardless of educational attainment, employment sector, or age.
That Message Can Wait: Texting While Driving Violations in PA
Texting while driving has become a disturbing trend in recent years. To combat this dangerous practice, the Pennsylvania General Assembly passed Act 98 of 2011, which prohibits texting while operating motor vehicles. The law instituted a $50 fine for anyone convicted of texting while driving.
According to data collected by AAA Mid-Atlantic Division, from the Administrative Office of Pennsylvania Courts, 1,263 texting while driving citations were issued in 2013. This is 14.2 citations for every 100,000 licensed driver in Pennsylvania.
In rural areas, 335 citations were issued, which is 13.4 citations for every 100,000 rural licensed driver. In urban areas, 928 citations were issued, or 14.6 citations for every 100,000 urban licensed driver.
The three counties with the highest number of citations per 100,000 licensed driver were Potter (69.3 citations), Cameron (51.6 citations), and Centre (45.7 citations). The three counties with the fewest number of citations per 100,000 licensed driver were Susquehanna (3.3 citations), Carbon (2 citations), and Crawford (1.6 citations). No citations were issued in Sullivan, Huntingdon, Fulton, Forest, and Clinton counties in 2013.
Texting While Driving Violations Per Licensed Driver by County, 2013*
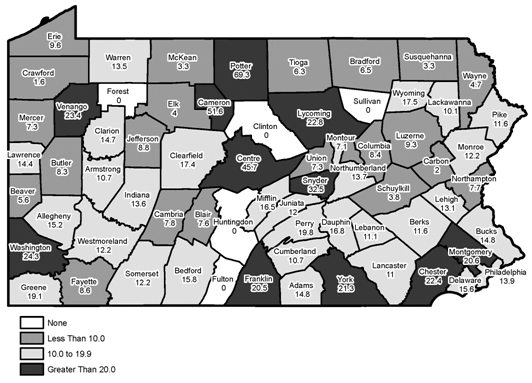
*Number of violations issued per 100,000 licensed drivers. Data excluded cases that were secured, sealed, or expunged. Citations were issued under Pennsylvania Consolidated Statutes Title 75, Section 3316. Data sources: AAA Mid-Atlantic from data collected by the Administrative Office of Pennsylvania Courts, 2013; Pennsylvania Department of Transportation, 2013.
Just the Facts: A License for Lucky
Pennsylvania law requires all dogs three months and older to be licensed.
According to data from the Pennsylvania Department of Agriculture, 966,300 dog licenses were sold in Pennsylvania in 2013.
In rural counties, 462,500 licenses were sold in 2013. That’s 134 licenses for every 1,000 rural residents. In urban counties, 503,800 licenses were sold or 65 licenses for every 1,000 urban residents.
The three counties with the highest number of licenses sold per capita were Fulton, Somerset, and Jefferson, each with more than 202 licenses per 1,000 residents.
The three counties with the fewest number of licenses sold were Lackawanna, Montgomery, and Delaware, each with less than 43 licenses per 1,000 residents. Data were not reported for Philadelphia County.
From 2009 to 2013, the number of licenses sold in rural Pennsylvania increased 2 percent. During that same period, the number of licenses sold in urban counties increased less than 1 percent.
The American Pet Products Association (APPA) estimated that, in 2013-2014, 56.7 million households in the United States have a dog. According to APPA, dog owners spend an average of $41 a year on dog toys, $65 a year on dog treats, and $231 a year on routine veterinary visits.
And, according to the Pew Research Center, 85 percent of dog owners consider their pet to be a family member. Those are some lucky dogs!
