Newsletters
- Home
- Publications
- Newsletter Archive
- Newsletter
May/June 2006
Inside This Issue:
- Pennsylvania’s Rural Population Has Its Ups and Downs
- Strategies to Recruit, Retain Volunteer Firefighters
- Chairman’s Message
- The Price of an Apple . . . and other assorted goods
- Behind the Numbers: Cost of Living
- Drug and Alcohol Treatment in Rural Pennsylvania
- Fast Fact
- Remember to Stand Up for Rural America on June 6
- Just the Facts: Volunteer Fire Companies
- Broadband Access and Use in Rural America
U.S. Census Bureau Releases Population Estimates
Pennsylvania’s Rural Population Has Its Ups and Downs
The ups and downs of Pennsylvania’s rural population are like the kiddie roller coaster at an amusement park; a gentle, rolling ride without all the dramatic drops, twists or turns. Just take a look at the most recently released population estimates from the U.S. Census Bureau.
According to the estimates from 2000 to 2005, Pennsylvania’s rural population increased about 1 percent overall. The growth, however, was not evenly divided among the state’s rural areas. In fact, rural counties in western Pennsylvania generally lost population, while those in eastern Pennsylvania generally gained population.
The state’s urban counties also experienced a net increase of 1 percent. The population change among urban counties was also strongest in the eastern portion of the state.
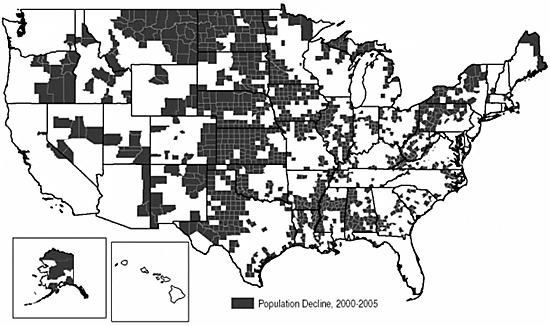
Nationally, there was a 5 percent increase in population during the five-year period of 2000 to 2005. Like Pennsylvania, however, the nationwide growth was also unevenly distributed. Counties in the Appalachian region and mid-west generally lost population while counties in the south and along the Pacific coast gained population.
Reasons for rural growth
Within rural Pennsylvania, the overall increase in population is largely attributed to in-migration. According to the Census estimates, more than 55,000 persons moved into rural Pennsylvania during the five-year period from 2000 to 2005. Approximately 82 percent of these new rural residents were from urban Pennsylvania or other states and 18 percent were from other countries. The counties with the highest in-migration increases were located in south central and northeastern Pennsylvania.
For those rural Pennsylvania counties that lost population between 2000 and 2005, two contributing factors were low birth rates and relatively high death rates. According to the Census estimates, 27 of the state’s 48 rural counties had more deaths than births during this period.
Xers and Latinos call rural areas home
According to the Census Bureau’s most recent age estimates, from 2000 to 2004, rural areas had a 2 percent increase in persons from the so-called “Generation X” age group. Born between 1965 and 1976, persons in this age group are economically significant since they are in the midst of their careers and buying homes. From a demographic perspective, however, Gen Xers appear to be holding off on starting families, since the birth rate in rural areas continues to stagnate or decline.
For educators, fewer births have important consequences for future school enrollment. According to the enrollment projections by the Pennsylvania Department of Education, between 2005 and 2015, the number of rural students enrolled in public schools is projected to decline 7 percent.
Another group coming to rural Pennsylvania is Latinos. Between 2000 and 2004, the Census Bureau estimated that the number of Latinos living in rural areas increased 33 percent. Even rural counties that lost total population during this period had a 16 percent increase in the number of Latinos calling these counties home.
Economy plays important role
Economic conditions were strongly correlated with rural population change. Between 2000 and 2004, rural counties that gained population had a 3 percent increase in employment and a 7 percent increase in employers, while rural counties that lost population saw a 3 percent decline in employment and a 2 percent increase in employers.
Here come the Boomers
Over the next five to 10 years, rural Pennsylvania will likely continue to attract new residents. This growth, however, likely will continue to be lopsided with eastern rural counties gaining population and western rural counties remaining the same or experiencing very slow or negative growth.
While the estimates continue to show growth in some rural counties, this growth is likely to be fueled by the in-migration of retiring “Baby Boomers,” who were born between 1946 and 1964, or by improving economic conditions.
Over the next 10-plus years, rural Pennsylvania is not likely to see any significant population increases. The low birth rate and aging population will probably cause a downward population turn. Unfortunately, this trend is already evident in many rural counties in the mid-western U.S. and Appalachian regions.
More population estimates
For more information about the U.S. Census Bureau's population estimates, visit the Census Bureau's website at www.census.gov or call the Center for Rural Pennsylvania at (717) 787-9555.
U.S. Counties with Declining Population, 2000-2005 (estimated)

Strategies to Recruit, Retain Volunteer Firefighters
Thanks to Benjamin Franklin, who organized the nation’s first volunteer fire company (VFC) in Philadelphia in 1736, Pennsylvania and the nation can rely on volunteer firefighters to respond to fire and other community emergencies. This 270-year-old tradition, however, may be in jeopardy in rural areas as increasing job demands, family commitments and other factors inhibit volunteerism.
Since rural Pennsylvania relies heavily on volunteers, the Center for Rural Pennsylvania sponsored research to better understand firefighter recruitment and retention issues and identify strategies that may help increase firefighter volunteerism in rural areas.
To complete the research, in 2003-2004, Dr. Robert D’Intino, former faculty member at Penn State University-Schuylkill, conducted a literature review, interviewed 41 senior-level fire officials in 32 states and 35 fire chiefs in rural Pennsylvania, surveyed 701 rural Pennsylvania firefighters, and interviewed 41 volunteer firefighters.
Findings
Information collected from fire service literature and interviews with state fire officials and rural chiefs indicate that volunteer firefighters are dedicated to community service and working hard to support the tradition of volunteer firefighting. Nevertheless, rural fire chiefs reported difficulties in obtaining sufficient funds and staff for their fire emergency operations. For example, 36 percent of the rural Pennsylvania fire chiefs interviewed said their VFC did not respond to one or more fire emergency calls over the past two years.
State fire officials around the nation agreed that volunteer firefighters spend most of their time fundraising, while they should be spending more time training. The key issues for these officials were funding, new apparatus and equipment, personal safety equipment, training, leadership and management, recruiting and retention, and state and municipal incentives for volunteer firefighters.
Rural Pennsylvania fire chiefs agreed that VFCs must be managed as businesses if they are to survive. Key issues of importance for the chiefs were maintaining fire emergency operations; funding new apparatus and equipment; providing adequate personal safety equipment; training; leadership and management; recruiting and retaining volunteers; and offering adequate state and municipal incentives for volunteer firefighters. When asked to identify their most important concerns, the majority of chiefs cited fundraising, retaining current members and recruiting new members, and providing mandatory training for all members.
The interviews with rural volunteer firefighters found individuals were proud to serve their communities as volunteers. The volunteers were knowledgeable about the operations and administration of their own VFC and many had positive comments about their own firefighter training. Comments about leaders in their VFC ranged from very positive to very negative.
Many firefighters suggested that additional fire officer leadership and management training would help all firefighters be more effective. While some of the firefighters interviewed did not want or expect financial benefits, others would accept some financial support for training, travel expenses, new personal fire protective gear, line of duty death benefits, life insurance, medical insurance, state income tax credits, college tuition assistance, or a pension plan.
The four highest ranked incentives to encourage individuals to join or be more active were proposals to provide Pennsylvania college tuition, improved personal protective clothing, state income tax credits, and new firefighting apparatus and equipment.
For retention incentives, the volunteer firefighters selected two distinct sets of top ranked preferences: one consisted of better firefighting equipment, and the other consisted of financial benefits for income tax credits, college education tuition, and health insurance.
More results available
For more research results, call the Center for Rural Pennsylvania at (717) 787-9555, email info@ruralpa.org, or visit www.ruralpa.org and request the report, Volunteer Firefighter Recruitment and Retention in Rural Pennsylvania.
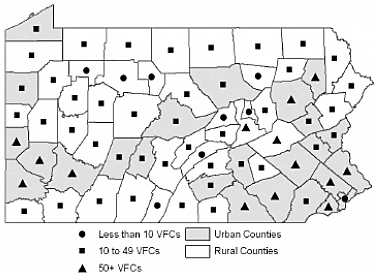
Number of Volunteer Fire Companies by County, 2005

Source: Pennsylvania Legislative Budget and Finance Committee, (2005), The Feasibility of Regionalizing Pennsylvania Volunteer Fire Companies. Note: For the project, the researcher used the Center for Rural Pennsylvania’s 1990 rural definition as follows: counties were considered rural if more than 50 percent of the population was defined as rural by the 1990 Census.
Chairman’s Message
The U.S. Census Bureau, the federal agency charged with maintaining all those figures about this country’s population, released 2005 estimates earlier this year. The Census Bureau officially gathers the data every 10 years and in the interim provides estimates about population change. The recent estimates show that Pennsylvania’s rural areas have been experiencing some population growth over the past five years. Overall, the Keystone State has been on the same path as well.
To those who keep an eye on Pennsylvania’s population, especially the population trends, it is apparent that not much has changed over the past 25-plus years. The commonwealth and its rural counties consistently show some population growth, especially in the eastern portion of the state, or no growth in other areas.
While the total numbers haven’t shown dramatic change over the years, one needs to look beyond them to see that the people who are populating rural counties are changing.
For example, rural Pennsylvania seems to be attracting more Generation Xers and Latinos. The former group is those who are between the ages of 30 and 41 years old, while the in-migrating Latinos tend to be much younger than the average rural Pennsylvanian (39 years of age). While there is no data to clearly document why these groups are coming to rural Pennsylvania, we can make some statements on the impacts they might have within their new communities.
It is reasonable to believe that they have the potential to stimulate the rural economy as they bring income into these areas, purchasing local goods and services, with many even purchasing a home. These newcomers, however, may not provide a huge boon to the population as the birth rate in rural Pennsylvania continues to remain steady or decline.
Data also indicate that, over the next 10 years, Baby Boomers will be making their way back to rural Pennsylvania. Older Boomers, who are now hitting their retirement years, seem to be attracted to the quality of life in rural Pennsylvania. This is evidenced, in part, by the roughly 5 percent increase in Baby Boomers from 1990 to 2000.
The movement of all of these groups into rural areas may present some challenges, as well. As some rural counties in the northeast and south central regions can attest, unplanned influxes of people from neighboring states, in a short period of time, can test the physical and social infrastructures of communities. Concerns about affordable housing, inadequate road systems, affordable transportation, overcrowded schools, limited funding for health and human services, and the tax base in general, are just some of the issues.
Meanwhile, other areas, especially in western Pennsylvania, continue to experience population declines. Population declines affect the local tax base, workforce supply to meet demand, and even education, as the issue of school consolidation rises to the surface.
There are positive signs in our rural communities that the issues brought about by population change are being recognized and addressed. Through partnerships with various state and regional agencies and resources, community development efforts are underway and success is being achieved.
There are no easy answers to the questions of how we can effectively manage growth, and solutions won’t come exclusively from either the state or local levels. Instead, the solutions will need to be a mixture of both; some that reflect our commonalities and others that allow for the diversity that is rural Pennsylvania.
Senator John Gordner
The Price of an Apple . . . and other assorted goods
If you keep tabs on the somewhat yearly price changes of goods and services, like apples, milk or even electricity, you’re keeping track of the cost of living. The U.S. Department of Labor’s Bureau of Labor Statistics (BLS) allows us to track prices of certain goods included in the consumer price index, which measures changes in the cost of living over time.
For example, in the 25 years from December 1980 to December 2005, red delicious apples nearly doubled in price from $0.50 to $0.97 per pound. Over the same period, the price of a pound of ground beef increased from $1.86 to $2.61; a half-gallon of whole milk rose from $1.09 to $1.61; and 500 kilowatts of electricity rose from $30.97 to $54.67. Expressed as a percent change, the price of apples grew 94 percent; the price of ground beef grew by 40 percent; the price of milk rose by 48 percent; and the price of electricity grew by 77 percent.
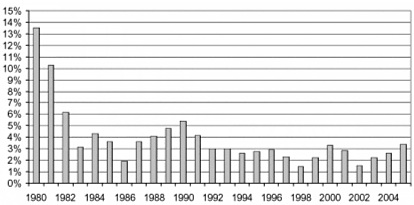
According to BLS, the cost of living in the U.S. has increased every year since 1956, sometimes rapidly, sometimes more modestly. In 1918, the cost of living grew 18 percent, the fastest rate on record.
In just the past 50 years, the year with the fastest growth in the cost of living was 1980 at 13.5 percent. In recent years, while the cost of living continues to increase, annual growth hasn't exceeded 5 percent (See chart below).
A Center for Rural Pennsylvania study released in 2000 compared the cost of living across the common-wealth’s 67 counties and found that costs in urban counties were typically about 6 percent higher than in rural counties. Rural counties had lower costs for each component of the index, including groceries, housing, utilities, transportation, health care, and miscellaneous goods and services.
Annual Percent Change in Cost of Living, 1980-2005

Behind the Numbers: Cost of Living
What is cost of living?
The amount of money needed to buy certain goods and services. Two types of indices are typically used to compare the price of certain goods and services, including food, housing and transportation, so that costs may be compared among communities or over time.
What does it measure?
The relative price of goods and services for a specific location or time period.
What does it tell us?
Relative prices in different places or times.
What doesn’t it tell us?
The absolute cost of living in the community.
How is the data collected?
Through surveys and through shopping for a “basket” of goods and services.
Where can I get it?
To compare cost of living across time, use the Consumer Price Index (CPI) from the U.S. Department of Labor’s Bureau of Labor Statistics. To compare cost of living across space, use the Cost of Living Index (COLI) from ACCRA-The Council for Community and Economic Research.
When to use it:
- CPI - To compare the cost of living in a community over time.
- COLI - To compare the cost of living in one community to another community.
Note: For a more detailed fact sheet. visit http://www.ruralpa.org/fact_sheets.html, call the Center for Rural Pennsylvania at (717) 787-9555 or email info@ruralpa.org.
Drug and Alcohol Treatment in Rural Pennsylvania
While there is no complete measure of alcohol and drug abuse in rural Pennsylvania, the Department of Health’s Bureau of Drug and Alcohol Programs and the Pennsylvania State Police have some data about those who abuse alcohol and drugs and those who seek treatment.
Who is being treated and why
The Department of Health licenses about 800 drug and alcohol (D&A) treatment facilities in the commonwealth, and those that receive money from the Department of Health must report client data. In fiscal year 2004-2005, 439 facilities reported client data, although a handful was not required to do so. The following information deals only with the data reported to the department.
In 2004-2005, 18,640 rural Pennsylvania residents were treated for drug and/or alcohol problems in the commonwealth, which amounts to 5.43 clients for every 1,000 rural residents and 28 percent of all clients statewide. Treatment refers to admission to a D&A program. Because many rural clients were treated more than once in the same year, there were about 24,300 admissions of rural Pennsylvania residents. In 1994-1995, there were significantly fewer drug and alcohol treatment clients, with about 14,380 unique clients and 19,200 admissions. The following client data are based on admissions, as they are not collected per unique client.
In 2004-2005, 66 percent of rural treatment program clients were male and 33 percent were female. Of the females, 2.3 percent were pregnant. Adults age 18 to 39 accounted for two-thirds of admissions.
Forty-five percent of rural treatment clients were admitted primarily for alcohol treatment. The primary drug of choice for 18 percent of clients was heroin, for 14 percent it was marijuana/hashish, for 12 percent it was cocaine/crack, and for 8 percent other opiates/synthetics. The remaining 3 percent had other primary drugs of choice. Methamphetamine was the primary drug of choice for nearly 200 rural clients.
According to data from the Department of Health, in 2004-2005, counties paid for drug and alcohol treatment for rural clients 37 percent of the time. Medicaid paid for 23 percent of admissions, health insurance for 15 percent, and the individual paid 5 percent of the time. Medicare and other government payments covered 6 percent.
Drug and alcohol crimes
In 2004, 35,125 arrests were made for drug and alcohol crimes in rural Pennsylvania, an increase of 8 percent from 1994. Drug abuse arrests rose by a whopping 80 percent, from about 3,860 in 1994 to about 6,960 in 2004. Drug and alcohol crimes accounted for 28 percent of all arrests in 2004.
Further breakdowns show that most rural drug and alcohol arrests in 2004 were adults, but 9 percent were juveniles (12 to 17 year olds). Alcohol crimes were much more common than drug crimes, accounting for 80 percent of total drug and alcohol arrests. Rural drug crimes were most frequently those of possession (72 percent), but 28 percent were for sale/manufacture. In 1994, sale/manufacture represented 19 percent of all drug arrests.
Early in the decade, the Pennsylvania State Police recognized a methamphetamine (meth) problem in the state. Data from the State Police Bureau of Criminal Investigation show that state, federal, or local law enforcement busted 93 meth labs in 2004 in rural counties. 2004 is the first year for which data are available by county and lab type.
In 2001, however, there were just 19 police responses to clandestine lab reportings, which can include finding a lab for meth, ecstasy, marijuana growing, other drugs, or even no lab at all. In 2002, 34 responses were reported, in 2003, 64 were reported, and in 2004, 128 were reported.
More information available
For the complete fact sheet, Drug and Alcohol Treatment in Rural Pennsylvania, contact the Center at (717) 787-9555, email info@ruralpa.org or visit www.ruralpa.org.
Fast Fact

Remember to Stand Up for Rural America on June 6
It's time to celebrate Stand Up for Rural America Day, scheduled for June 6, 2006. Stand Up for Rural America, a national coalition of community developers, is sponsoring the event.
Every two years, Stand up for Rural America holds a day-long celebration in Washington D.C. to raise awareness about rural America and the community developers that serve it, helping them gain attention, resources and policy support for their work.
To celebrate the day, the coalition will host a picnic lunch and forum on “Making Rural America Work” at the Ronald Reagan International Trade Center, 1300 Pennsylvania Avenue, NW, Washington, D.C.
Featured speakers for the event include U.S. Secretary of Agriculture Mike Johanns and Kansas Governor Kathleen Sebelius. Following the forum, a reception will be held in the Great Hall at the Thomas Jefferson Building Library of Congress.
For more information about the event, visit www.ruralamerica.org or call (202) 739-9276.
Just the Facts: Volunteer Fire Companies
Rural Pennsylvanians rely on local volunteer fire companies (VFCs) for emergency services.
According to 2005 data from the Pennsylvania Office of the State Fire Commissioner, there were 2,354 volunteer fire companies statewide. Of these, approximately 47 percent were located in rural counties and 53 percent were located in urban counties.
Statistically, on a per capita basis, there are twice as many rural volunteer fire companies than urban companies. Why? In large urban areas, fire services are typically provided by professional firefighters, not volunteers.
In addition, geography plays a large role. The average rural volunteer fire company has a 30-square-mile service area, while the average urban company has a 10-square-mile service area.
Nationally, according to data from the U.S. Fire Administration, in 2005, there were 17,438 all-volunteer fire companies. The states with the most volunteer fire companies were Pennsylvania, New York, and Texas, each with more than 950 companies. On a per capita basis, however, the states with the most volunteer fire companies were North Dakota, South Dakota, and Vermont, each with more than 25 companies for every 100,000 residents. Pennsylvania ranked 17th in the number of volunteer companies per capita.
Broadband Access and Use in Rural America
High-speed, or broadband, Internet access is improving in rural areas nationwide, but continues to lag behind urban and suburban areas, according to a report released by the Pew Internet and American Life Project. The report, which was based on a survey of 5,262 adults nationwide and conducted in 2005, suggests that the biggest obstacle to broadband access in rural areas is the lack of necessary infrastructure, such as digital subscription lines (DSL) and cable.
According to the report, from 2003 to 2005, the number of rural residents in the U.S. with broadband Internet access at home had almost tripled, growing from 9 percent to 24 percent. This is in contrast to the growth in at-home broadband access from 22 percent to 39 percent among urban and suburban residents.
The report cites several possible reasons for the lack of broadband Internet access in rural areas, including the remoteness of some rural areas and the relative expense of building the necessary infrastructure to support access.
In terms of Internet use, the report cites demographics, and not rural location, as a reason for lower use among rural residents. That is, rural residents tend to be older and have lower incomes and educational levels than the average American. These characteristics are often associated with lower levels of Internet use.
For more on the project findings or a copy of the report, visit the Pew Internet and American Life Project at www.pewinternet.org.
