Newsletters
- Home
- Publications
- Newsletter Archive
- Newsletter
March/April 2015
Inside This Issue:
- Homelessness in Rural Pennsylvania
- Research Examines Hate and Bias Incidents in Pennsylvania
- Chairman's Message
- Center Board Welcomes New House Member
- Rural Snapshot: Technology and Internet Service, Connectivity
- Private School Enrollment in Pennsylvania
- Just the Facts: Crime Rates
Homelessness in Rural Pennsylvania
Research on the rural homeless, conducted by Dr. Heather Feldhaus and Avi Slone of Bloomsburg University and sponsored by the Center for Rural Pennsylvania, found that homelessness in rural counties increased in the past 5 years and rural clients had slightly higher rates of mental health and substance abuse issues than urban clients.
The research also found that existing data likely significantly undercount the rural homeless.
Research background
Homelessness is a difficult issue to document since the homeless population is largely hidden, stigmatized and transient. Documenting rural homelessness is even more complex since many people in rural areas do not have access to more formal services, such as shelters, and tend to use more informal networks, such as friends or family, for assistance.
To conduct their research and overcome some of these difficulties, Feldhaus and Slone analyzed existing data on the homeless collected yearly by the federal Department of Housing and Urban Development through its Continuum of Care sites, surveyed professionals who work with the rural homeless, and summarized information gathered at two homelessness summits in Pennsylvania in 2012 and 2013.
In their analyses, the researchers found that limitations associated with the available data on rural homelessness are substantial. These include the challenges of counting unsheltered homeless in large geographic areas and the various data collection systems being used by service providers.
From the data that were available, the research found clear differences among the homeless in rural and urban areas and an increase in the number of homeless counted in rural areas.
The research also indicated that the rural homeless exhibit high rates of health and substance abuse problems.
According to the research, regional differences exist between rural parts of the state both overall and in the rates of homelessness among veterans and the chronically homeless.
The survey results indicated a rise in homelessness in the past 5 years, particularly in rural counties; these results corresponded with data patterns at the state and regional levels. The survey results also indicated slightly higher rates of mental health and substance abuse issues among rural clients. The survey respondents were concerned about the inconsistencies in the definitions of homelessness used by different agencies, organizations, and programs, and with the definitions that exclude clients who are living temporarily with family or friends.
This research underscores the point that inconsistency in data collection methods represents a lost opportunity to help increase the understanding of and the ability to track homelessness at the state and local levels.
Information from the homelessness summits confirmed the data weaknesses identified in the research.
For a copy of the report, Homelessness in Rural Pennsylvania, visit http://www.rural.palegislature.us/publications_reports.html or call the Center at (717) 787-9555.
Research Examines Hate and Bias Incidents in Pennsylvania
Research conducted by faculty from Penn State University and sponsored by the Center for Rural Pennsylvania found that the number of hate and bias incidents in Pennsylvania increased from 1999 to 2012. The research also found that criminal incidents showed high fluctuations, but were roughly flat overall, while both civil incidents and tension incidents, which are non-criminal acts of bias that may inflame a community, increased during the approximately 14 years examined. Hate group activity varied greatly from year to year.
According to the research, which was conducted in 2014, cases of prosecuted ethnic intimidation (the hate crime statute in Pennsylvania) remained at low levels.
Professor Barry Ruback, Andrew Gladfelter and Brendan Lantz conducted the study of hate and bias incidents in Pennsylvania using information gathered by the Pennsylvania Human Relations Commission (PHRC) from 1999 to 2012. The PHRC data came from media accounts and reports from police agencies, advocacy groups, county coalitions, and victims. While the dataset has some limitations, it is the best source for examining hate and bias incidents in Pennsylvania since it includes actual bias incidents confirmed by the police and possible bias incidents not reported to the police.
In addition to the PHRC data, the researchers used demographic, social, and economic data from the U.S. Census Bureau, and data from the U.S. Department of Education for analyses related to incidents at higher education institutions.
According to the research, most hate and bias incidents occurred in urban municipalities. However, incidents in rural municipalities were more likely than incidents in urban municipalities to be criminal.
The research found that, across the 1999-2012 period, there were no significant differences in the rates of hate and bias incidents per 100,000 population.
According to the data, 33 percent of the victims of criminal incidents were black, 10 percent were Jewish, 8 percent were LGBT (lesbian, gay, bisexual, transgender), 7 percent were Hispanic and 3 percent were Muslim.
In about 35 percent of the overall incidents in the dataset, the offender was not known. Of the cases in which the offender was identified, most were individuals or small groups of individuals, as opposed to organized groups, and were disproportionately white.
Most criminal incidents were committed against individuals of a different race and the most typical criminal incident was of a white offender and a black victim.
As compared to incidents when an individual offender was identified, when hate groups were identified, the incident was less likely to involve a crime. If a crime occurred, an arrest was more likely if a hate group, rather than an individual, was involved. Hate groups largely engaged in noncriminal acts such as rallies, protests, and distribution of literature.
The research found that both law enforcement and civil rights agency responses to hate and bias incidents increased over time, but especially by civil rights organizations.
The research also found that 4 percent of hate and bias incidents occurred at higher education institutions.
It is important to recognize that the findings from this study are limited since the PHRC data disproportionately represent some areas of the state. In addition, because some reports in the PHRC database are not verified, some reported incidents may not have been discriminatory or motivated by bias. Despite these limitations, the PHRC database is the best source for examining hate and bias incidents in Pennsylvania.
For a copy of the report, An Examination of Hate and Bias Incidents in Pennsylvania, 1999 €“ 2012, visit the Center’s website at http://www.rural.palegislature.us/publications_reports.html or call (717) 787-9555.
Chairman's Message
At the March meeting of the Center’s Board of Directors, the board approved a list of targeted topics for the Center’s 2016 Research Grant Program Request for Proposals, or RFP. Every March, the Center issues its RFP, which provides details on the research program and lists specific topics for research, which currently include emergency medical services, community health workers, local parks and recreation areas, the impact of minimum wage increases, wildlife tourism, unemployment and underemployment, public transportation, and changes in homeownership.
The program is open to qualified faculty members of Pennsylvania State University, the State System of Higher Education universities and the regional campuses of the University of Pittsburgh, which are in Bradford, Greensburg, Johnstown and Titusville. We encourage them to submit their Letters of Intent for the program and to partner with other academic institutions, community organizations, and other public and private agencies if suitable.
Some fine examples of the research sponsored by the Center are featured in this issue of Rural Perspectives. The research provided some very important insights and information about two topics that are not often studied in rural areas, namely homelessness and hate and bias incidents.
For the study on homelessness, the research team from Bloomsburg University found that limitations associated with the available data on rural homelessness were substantial. The research team from Penn State University who studied hate and bias incidents also used data that had specific limitations, such as the way data were collected. However, both studies provided results that offer a clearer picture of both issues. And ultimately, the results from both studies indicate how important reporting is to address and combat both homelessness and hate and bias occurrences across Pennsylvania. Copies of both reports are available online or by calling the Center.
At the March meeting, the Center board welcomed its newest member, Representative Sid Michaels Kavulich. The board looks forward to his contributions and welcomes his expertise and experience on rural issues.
I would also like to thank all of the Center’s board members for their commitment to the Center, their continuing support and their active participation to help ensure the work of the Center remains timely and relevant to its mission.
Senator Gene Yaw
Center Board Welcomes New House Member
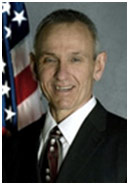
In February, the Center for Rural Pennsylvania welcomed Representative Sid Michaels Kavulich to the Board of Directors. Representative Kavulich represents the 114th Legislative District in northeastern Pennsylvania, which includes portions of Lackawanna, Luzerne, Susquehanna and Wyoming counties.
He was first elected to the state House of Representatives in 2011 and serves on the Agriculture and Rural Affairs, Finance, Game and Fisheries, Gaming Oversight and Local Government Committees and the Committee on Ethics.
Prior to serving in the House, he was a communications specialist for the Pennsylvania Democratic Senate Communications Office, a broadcaster for several radio and television stations in northeastern and central Pennsylvania, and general manager of St. Ann’s Media at St. Ann’s Basilica in Scranton.
Rep. Kavulich is involved with several civic organizations, including Catholic Social Services of the Diocese of Scranton, where he served as president. He is also a member of Broadway Theatre League of Northeastern Pennsylvania, the Abington Rotary and the Stephanie Jallen Group.
Rural Snapshot: Technology and Internet Service, Connectivity
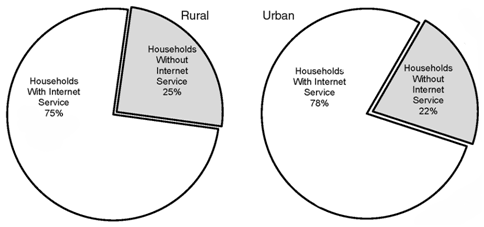
Rural and Urban Households With and Without Internet Service, 2013
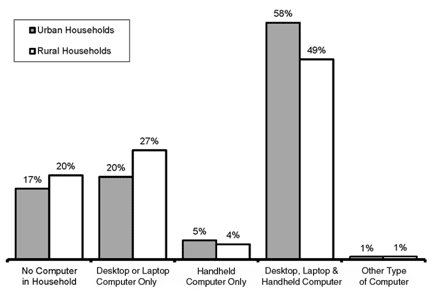
Rural and Urban Households by Device Type, 2013
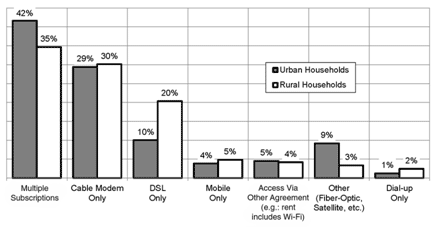
Rural and Urban Households by Internet Connection Method, 2013
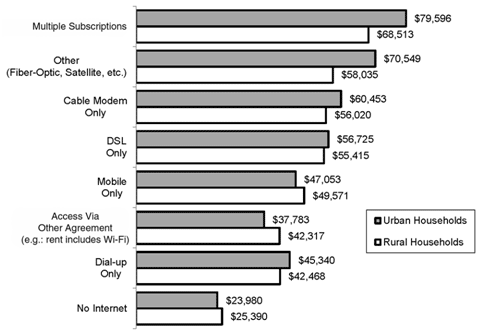
Median Household Income by Type of Internet Connection Method, 2013
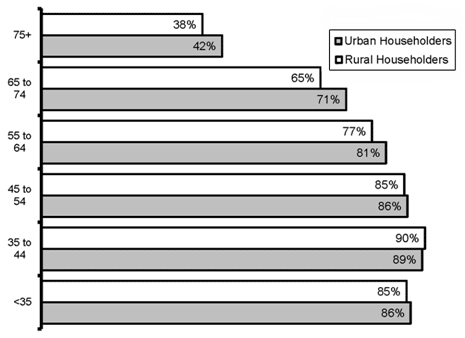
Homes With Internet Service by Age of Householders, 2013
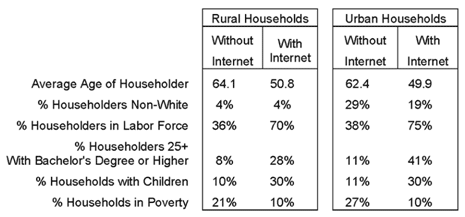
Profile of Rural and Urban Households With and Without Internet Service, 2013
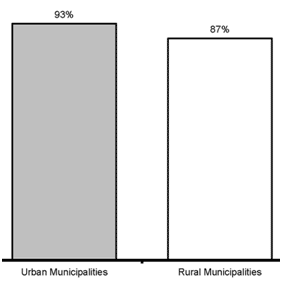
Percent of Rural and Urban Municipalities with Email Addresses, 2015
Data source for all graphs/tables except Percent of Rural and Urban Municipalities with Email Addresses: 2013 American Community Survey, Public Use Microdata Sample (ACS-PUMS), U.S. Census Bureau. Data source for Percent of Rural and Urban Municipalities with Email Addresses: Pennsylvania Department of Community and Economic Development’s Governor’s Center for Local Government Services, 2015.
Private School Enrollment in Pennsylvania
During the 2013-14 school year, one out of 12 rural students (8 percent) attended a private school, according to data from the Pennsylvania Department of Education. In urban Pennsylvania, one out of seven students (14 percent) attended a private school.
According to the data, 68 percent of rural and 62 percent of urban private school students attended elementary schools (grades K-7). Twenty-two percent of rural and 29 percent of urban private school students attended secondary schools (grades 8-12). The remaining 10 percent of rural and 9 percent of urban students attended what the Department of Education calls “other types of private schools,” which included special education schools and nursery schools.
In 2013-14, there were 701 private schools in rural Pennsylvania. These schools had an average enrollment of 56 students. In urban Pennsylvania, there were 1,864 private schools, with an average enrollment of 116 students.
From 2009-10 to 2013-14, rural and urban private school enrollment declined. Rural private school enrollment declined 5 percent while urban private school enrollment declined 11 percent.
Public school enrollment declined over the past few years as well. During the same 5-year period of 2009-10 to 2013-14, rural public school enrollment dropped 5 percent and urban public school enrollment decreased less than 1 percent.
Data from the U.S. Department of Education’s National Center for Education Statistics (NCES) showed that, nationwide, in 2011-12, the most current year for which data were available, there were 3.96 million private school students, or 7 percent of all students.
According to the NCES data, the states with the highest percentage of private school students were Hawaii, Delaware, Louisiana, and Rhode Island, each having more than 12 percent of all K-12 students enrolled in a private school. Alaska, Utah, and Wyoming had the lowest percentage of private school students, each with less than 4 percent enrolled. Pennsylvania had the nation’s eighth highest private school enrollment with 10 percent. From 2007-08 to 2011-12, private school enrollment declined in every state except Arkansas, Hawaii, North Carolina, Oklahoma and Wyoming.
Profile of Rural Households with Students in Private, Public and a Mix of Schools, Grades K-12, 2013*
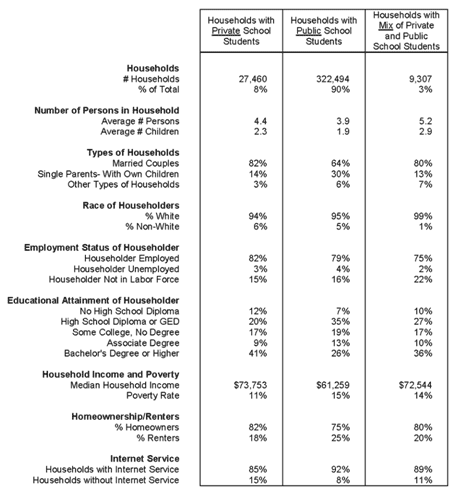
*Note: Profile includes households with children, age 5 to 18, enrolled in grades K-12 who have not yet received a high school diploma. Households with a “mix,” have some children enrolled in public schools and others enrolled in private schools. Data source: U.S. Census Bureau’s 2013 American Community Survey, Public Use Microdata Sample (ACS-PUMS).
Just the Facts: Crime Rates
According to 2013 data from the Pennsylvania State Police (PSP) Uniform Crime Report, there were fewer serious crimes reported in rural counties than in urban counties.
In 2013, there were 64,594 serious crimes reported in rural Pennsylvania, or 1,874 crimes per 100,000 residents. According to the PSP data, these crimes included both violent crimes, such as criminal homicide, rape, aggravated assault, burglary, and robbery, and property crimes, such as motor vehicle theft, larceny theft, and arson.
The same year in urban Pennsylvania, there were nearly four times as many serious crimes reported than in rural Pennsylvania. In total, there were 242,323 serious crimes in urban counties, with a per capita rate of 2,598 crimes per 100,000 residents.
From 2012 to 2013, serious crimes throughout Pennsylvania declined. Rural counties experienced a 3 percent decline and urban counties had a 6 percent decline in reported crimes.
In rural counties, property crimes accounted for 90 percent and violent crimes accounted for 10 percent of serious offenses in 2013. In urban counties, 85 percent of serious offenses were property crimes and 15 percent were violent crimes.
The PSP data indicated that, in 2013, Philadelphia, Dauphin and Lehigh counties had the highest serious crime rates in Pennsylvania overall, each with crime rates above 2,850 per 100,000.
The counties with the lowest serious crime rates in 2013 were the rural counties of Juniata, Armstrong, and Union, each with rates under 1,050 per 100,000.
