Newsletters
- Home
- Publications
- Newsletter Archive
- Newsletter
March/April 2014
Inside This Issue:
- The Challenges of Rural Prisoner Reentry
- Projections Indicate Overall Population Increase for Pennsylvania in Coming Years
- Chairman's Message
- Rural Snapshot: Rural Youth Education Study €“ Boys vs. Girls
- Rural Property Market Values Experiencing Bumpy Ride
- Just the Facts: Low Mileage
The Challenges of Rural Prisoner Reentry
According to research on the reentry of state prison and county jail inmates to rural communities in Pennsylvania, employment, housing, and transportation are the leading challenges facing inmates.
The research, conducted by Dr. Gary Zajac, Robert Hutchison, and Courtney A. Meyer of Pennsylvania State University, also found that the challenges of finding work and suitable housing were magnified for “hard to place” offenders, such as those with serious mental illness and sex offenders.
Research background
The study, sponsored by the Center for Rural Pennsylvania and conducted in 2012-2013, explored issues and challenges surrounding the reentry of state prison and county jail inmates to rural Pennsylvania communities.
Reentry refers to the process of a prisoner transitioning to the community after a period of secure confinement in a state or federal prison or county jail.
The research used secondary data from the Pennsylvania Department of Corrections and the Pennsylvania Board of Probations and Parole and primary data from interviews and surveys.
The study estimated the number of state prison and county jail inmates to be released to each of Pennsylvania’s 48 rural counties over the next 5 years, identified reentry challenges, documented the reentry programs offered within the state and local correctional systems in Pennsylvania, and examined any gaps between reentry services needed by returning inmates and community programs available.
The research indicated that the release of county jail inmates to rural counties was projected to hold constant over the next 5 years, and the release of state inmates was projected to increase slightly over the same period. It indicated that the most likely explanation for the slight increase in the release of state inmates is that state parole approval rates have increased somewhat over the past several years. The most notable demographic trends among inmates being released were an increase in the number of older inmates, and a slight increase in the number of female inmates.
Employment, housing, and transportation emerged as key challenges facing inmates returning to rural areas.
Transportation is crucial to the reentry process as the lack of public transit in rural areas can hamper returning inmates in finding and getting to jobs, finding housing, getting to treatment groups and medical and mental health appointments, and making required meetings with their parole agents.
While there seemed to be a reasonably robust network of social services and programs in rural counties for returning inmates, services were unevenly distributed between rural counties. And, there were very few reentry programs for sex offenders in rural counties, and almost no programs that specifically addressed the most important rehabilitative criminogenic needs of ex-offenders, such as programs that address thinking, decision-making and problem-solving skills and peer networks, all of which are strongly linked to recidivism reduction.
Policy considerations
The researchers offered several policy considerations that may inform efforts to enhance reentry for state and county inmates being released to rural Pennsylvania. The most prominent considerations focused on further addressing the transportation, mental health services, and criminogenic needs of offenders.
Report available
For a copy of the research report, An Examination of Rural Prisoner Reentry Challenges, call or email the Center at (717) 787-9555 or info@rural.palegislature.us or visit www.rural.palegislature.us.
Projections Indicate Overall Population Increase for Pennsylvania in Coming Years
Pennsylvania is projected to see an overall increase in population from 2010 to 2040, according to population projections recently released by the Center for Rural Pennsylvania.
The projections, completed by Penn State Harrisburg’s Institute of State and Regional Affairs in 2013, indicate that 48 counties will gain population and 19 counties will lose population.
The state’s rural counties are projected to experience a 4 percent population increase from 2010 to 2040, and urban counties are projected to see a 14 percent increase.
As it has in the past, Pennsylvania’s rural population is likely to grow slowly, and the age of its residents will continue to increase. However, in-migration looks like it will play a larger role in spurring population growth in the years ahead.
For more information, visit the Center's website, http://www.rural.palegislature.us/demographics_population_projections.html, for: the fact sheet, Looking Ahead: Pennsylvania Population Projections 2010 to 2040; the report, Pennsylvania Population Projections 2010-2040, which provides the methodology used to prepare the projections; and the population projections data for individual counties by gender and age group.
Percent Change in Population by County, 2010 to 2040 (projected)
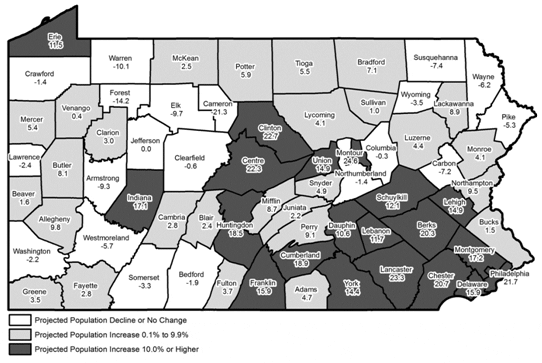
Data sources: U.S. Census Bureau and Pennsylvania State Data Center.
Chairman's Message
By 2040, Pennsylvania’s population is expected to exceed 14 million people. According to recent population projections developed by Penn State Harrisburg’s Institute of State and Regional Affairs for the Center for Rural Pennsylvania, our state’s rural population is likely to grow about 4 percent while our urban population is likely to grow 14 percent.
A very interesting aspect of those projections is the source of the population growth. Rather than natural growth from births, it looks as though people moving into Pennsylvania, or in-migration, will play a big role in growing our state. If the estimates hold true, almost 72 percent of our population growth will be due to people moving into Pennsylvania, with more than 85 percent coming from overseas in-migration.
How will rural Pennsylvania benefit from this opportunity to grow its population? Based on prior Center-sponsored research, international immigrants may find our rural communities an attractive place to live, work and raise a family. Surveys conducted on rural residents for the Center have shown that they find their local communities to be desirable places to live, they feel fairly safe living in rural areas, and they see rural Pennsylvania as offering a high quality natural environment. They also noted that their communities are good places to raise children and good places to retire. Maintaining those attributes and sense of place will not just happen on its own.
Thinking about what may happen almost 30 years from now can be daunting for many people, especially given the challenges that face us today. Much of the Center for Rural Pennsylvania’s work is focused on helping elected officials at all levels of government, community leaders, and rural citizens have information needed to make informed decisions about their future.
The 2040 population projections, covering all 67 Pennsylvania counties, provide much food for thought about who will be the future of our commonwealth €“ who may be our entrepreneurs, civic leaders, or elected officials of tomorrow. The projections also identify an increasingly aging population, some of whom will need supportive community-based services to remain active citizens. As the Center makes this rich database available through our website and publications, I encourage you to avail yourselves of this information and to start planning for tomorrow.
Senator Gene Yaw
Rural Snapshot: Rural Youth Education Study €“ Boys vs. Girls
The Center for Rural Pennsylvania contracted with Pennsylvania State University researchers in 2004 to begin a longitudinal study of rural Pennsylvania school students to understand their educational, career and residential goals and the factors influencing these goals.
The Rural Youth Education Study followed two groups of youth from 11 rural Pennsylvania school districts. The study collected data every other year for four waves beginning in 2005.
At the beginning of the study, the younger group was in 7th grade and the older group was in 11th grade. By the final wave, the younger group was 1 year out of high school and the older group was 5 years out of high school.
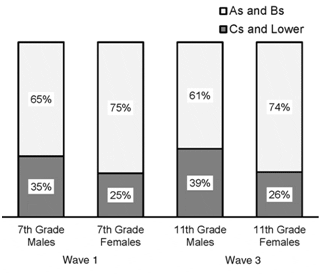
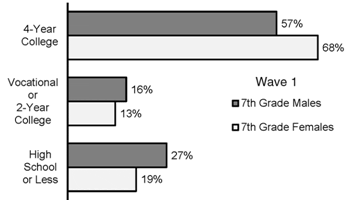
This installment of Rural Snapshot centers on the responses from the younger group of students, who were in 7th grade during Wave 1 and in 11th grade during Wave 3, according to gender.
Researchers who want access to the data for further analysis should call or email Jonathan Johnson at (717) 787-9555 or johnsonj@rural.palegislature.us.
Prior Year Grades of Male and Female Students, Waves 1 and 3
Educational Attainment Goals of Male and Female Students, Waves 1 and 3
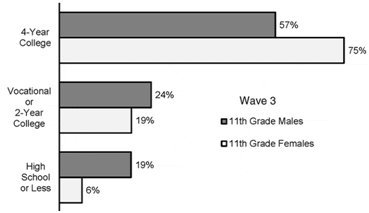
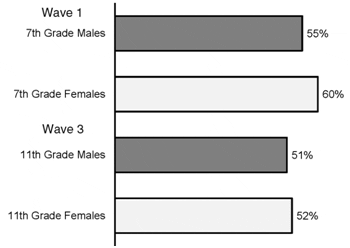
Participation in Non-Sport School Activities by Male and Female Students, Waves 1 and 3
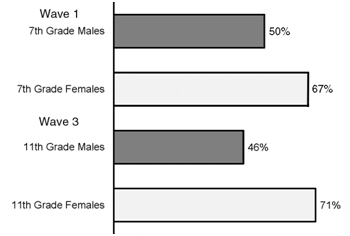
Participation in School Sports by Male and Female Students, Waves 1 and 3*
* Includes intramural sports and cheerleading.
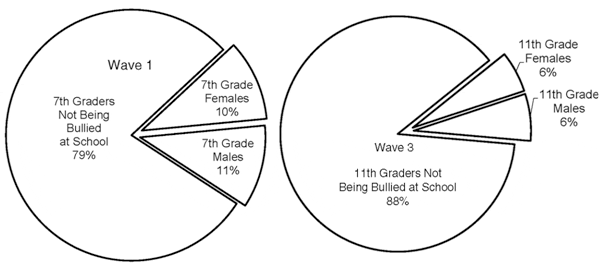
Percent of Male and Female Students Who Were Bullied at School, Waves 1 and 3*
*Students who agreed or strongly agreed that they were bullied by other students at school.
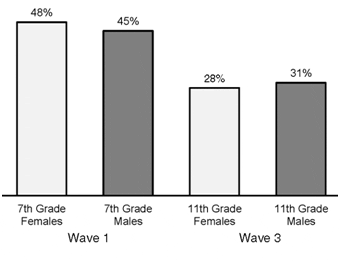
Percent of Male and Female Students Who Liked Living in Their Community, Waves 1 and 3
Rural Property Market Values Experiencing Bumpy Ride
Property market values in rural Pennsylvania have been on a bumpy ride over the past 5 years, according to data from the Pennsylvania State Tax Equalization Board. In 2008, at the beginning of the “great recession,” the total value of all taxable property in Pennsylvania rural municipalities was $153.1 billion. Over the next 2 years (2009 to 2010), property values peaked at $166.1 billion, and in 2011, they fell by $3.4 billion, or 2 percent. In 2012, however, the decline reversed itself and property market values increased $2.3 billion to $165 billion (1 percent). Property market values in urban municipalities experienced a similar roller-coaster ride.
A closer analysis of the data revealed that property market values in all rural municipalities have not bounced back to the 2008 levels. From 2008-2012, the market values in 324 rural municipalities, or 20 percent of all Pennsylvania rural municipalities, declined. The majority of these municipalities (64 percent) are located in western Pennsylvania.
During the same period, property market values in 1,268 rural municipalities (80 percent) increased. Interestingly, 596 municipalities had market value increases of 10 percent or more. These rural municipalities are located in northeast and central Pennsylvania.
To better understand why property market values in some rural municipalities declined while values in others increased significantly (10 percent or more) over the 5-year period, the Center for Rural Pennsylvania compared various demographic and socio-economic indicators in these two types of municipalities.
The results indicated no significant differences in these types of rural municipalities in terms of population, age groups, incomes and poverty. Both had similar populations; similar percentages of people under 18 years old and 65 years old and older; similar median household incomes; and similar poverty rates. In addition, there were no significant differences in the number of municipal employees per capita and in real estate taxes and earned income taxes per capita.
Among the indicators that were significantly different were housing values and household types. In rural municipalities with a large increase in market values, the average home value was $169,780, or more than $12,600 higher than the average home value in rural municipalities with a decline in market values. Municipalities with increases in market values had a higher percentage of married couple households (59 percent) and a lower percentage of single person households (23 percent) than municipalities with a decline in property market values (56 percent and 25 percent, respectively).
Another key difference between the two types of rural municipalities was per capita market values. In municipalities with an increase in property market values, the per capita value in 2012 was $63,088, while in municipalities with a decline in the per capita value was $49,331.
Finally, among municipalities with an increase in property market values, there were more gas and oil wells drilled between 2008 and 2012 (6,611 wells) than in municipalities with a decline (3,484 wells).
Rural Municipalities with Decreases and Increases in Property Market Values, 2008 to 2012
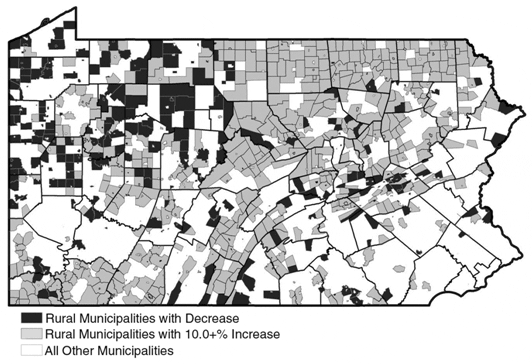
Data source: Pennsylvania State Tax Equalization Board. Data adjusted for inflation using the CPI-U with 2012 = 100.
Just the Facts: Low Mileage
According to the most recent data from the Pennsylvania Department of Transportation (PennDOT), vehicle traffic on rural county roadways is declining. From 2008 to 2012, the number of daily vehicle miles traveled on rural county roads decreased 6 percent. In urban counties, there was an 8 percent decline in daily vehicle miles traveled. Daily vehicle miles traveled (DVMT) is a measure of the total miles traveled by all vehicles.
In 2012, the total DVMT for all roadways in Pennsylvania was 204.3 million, which is a decrease of more than 16.7 million miles from 2008. The three counties with the highest decrease in DVMT from 2008 to 2012 were Allegheny (21 percent), Juniata (21 percent), and Erie (18 percent). The three counties with the highest increase in DVMT were Bradford (22 percent), Sullivan (11 percent), and Tioga (8 percent). Five counties had no change in DVMT: Lycoming, Jefferson, Monroe, Lehigh, and Columbia.
While DVMT is decreasing, the number of licensed drivers is increasing. In 2008, rural licensed drivers drove an average of 33 miles per day. Five years later, in 2012, the average dropped to 30 miles per day. During the same period, the number of rural licensed drivers increased 2 percent.
In 2008, urban licensed drivers drove an average of 23 miles per day, and, in 2012, the average dropped to 20 miles. From 2008 to 2012, the number of urban licensed drivers increased 3 percent.
In addition to the increase in licensed drivers, there has been an increase in registered vehicles. According to PennDOT records, from 2008 to 2012, there was a 2 percent increase in registered vehicles in rural Pennsylvania and a 1 percent increase in urban.
According to the Federal Highway Administration, the annual vehicle miles traveled in the U.S. declined 0.3 percent from 2008 to 2012. Overall, 26 states had a decline in miles traveled. The states with greatest declines were Mississippi (12 percent), Pennsylvania (8 percent), and West Virginia (8 percent). Of the 24 states with an increase in vehicle miles traveled, North Dakota (29 percent), Nevada (16 percent) and Montana (10 percent) had the greatest increases.
