Newsletters
- Home
- Publications
- Newsletter Archive
- Newsletter
March/April 2012
Inside This Issue:
- Estimates Indicate Increase in Rural Poverty
- Chairman's Message
- Center Board Welcomes New House Members
- Rural Snapshot: Women
- Fast Fact: Unemployment\Employment Rates
- Reported Incidents of Bullying in Pennsylvania Schools
- Just the Facts: Homelessness
Estimates Indicate Increase in Rural Poverty
More than 467,500 rural Pennsylvanians, or 14 percent of the rural population, lived in poverty in 2010, according to U.S. Census Bureau estimates for that year. From 2006 to 2010, the number of rural residents in poverty increased 13 percent.
In urban counties, approximately 1.18 million people, or 13 percent of the urban population, lived in poverty in 2010. From 2006 to 2010, the number of urban residents in poverty increased 14 percent.
In 2010, the Census Bureau's poverty threshold for a three-person household was $17,374. In 2006, the threshold for the same type of household was $16,079.
The increase in poverty is not unique to rural and urban Pennsylvania. Across the nation, 46.2 million people lived in poverty in 2010, a 19 percent increase from 2006.
Compared to other states, Pennsylvania had the 31st highest poverty rate of 13 percent. Mississippi and New Mexico had the highest rates of more than 19 percent, while Maryland and New Hampshire had the lowest rates of less than 10 percent.
Within Pennsylvania, Forest, Fayette, and Philadelphia counties had the highest poverty rates, each at or above 20 percent. The three southeast counties of Bucks, Chester, and Montgomery had the lowest rates, each with less than 7 percent.
Rural Pennsylvania analysis
For a closer look at rural residents in poverty, the Center for Rural Pennsylvania analyzed 2010 data from the U.S. Census Bureau's American Community Survey Public Use Microdata Sample (ACS-PUMS). The analysis revealed that:
Rural residents living in poverty were predominately female (56 percent) and young (average age is 32). In terms of age, 30 percent were under 18 years old, 60 percent were 18 to 64 years old, and 10 percent were 65 years old and older.
Among rural adults (18 years old and older) who were in poverty, 58 percent were not in the labor force. Among the 42 percent who were in the labor force, 72 percent were employed and 28 percent were unemployed.
Twenty-three percent of rural adults in poverty did not graduate from high school; 43 percent graduated from high school; 22 percent attended college, but did not graduate; and 12 percent had an associate's degree or higher.
Forty-six percent of rural adults in poverty have never been married. Among the 54 percent who have been married, 41 percent were currently married; 15 percent were widowed, and 44 percent were either separated or divorced.
Among rural residents in poverty who were under 65 years old, 21 percent did not have health insurance.
The typical rural household in poverty had 2.4 persons. Thirty-six percent of rural households in poverty had children (under 18 years old) and 64 percent did not.
Forty percent of rural householders in poverty were homeowners and 60 percent were renters. Among renters, the median gross rent was $580 a month, or approximately 60 percent of their household income.
Estimated Poverty Rates in Rural and Urban Pennsylvania, 2006-2010

Data source: U.S. Census Bureau
Chairman's Message
On behalf of the Center's Board of Directors, I welcome our newest board members Representative Garth Everett and Representative Rick Mirabito. The board looks forward to their contributions and welcomes their expertise and experience on rural issues.
Last year, Hurricane Irene and Tropical Storm Lee caused some devastating damage across Pennsylvania. As of February 13, the damage statewide totaled more than $11.3 million. Of that amount, $4.6 million in damages occurred in 21 rural Pennsylvania counties, the majority of which sit in the eastern region of the state.
While much of the media attention about the impacts of that hurricane and storm has subsided, the damage that these storms caused in our rural counties is still visible today. And many rural residents are still trying to clean up their communities and prevent this magnitude of flooding from happening again.
To learn firsthand from rural residents and officials about the challenges they face in clearing the region's stream channels to minimize the danger of future flooding, I participated in a listening session on stream cleaning hosted by the Center for Rural Pennsylvania on January 19. The session was held at the Sullivan County Conservation District and Agriculture Center in Dushore, Pa. At the session, local elected officials and local business owners and residents from the affected counties of Bradford, Lycoming, Sullivan and Susquehanna, along with members of the Pennsylvania Farm Bureau, offered testimony regarding the flooding and its impact.
At the session, we heard that the region is still dealing with the aftermath of the flooding, and attendees offered advice on what could be done at the state level to help those affected. The information compiled at the session is being shared with the legislature and executive branch agencies to review policies or regulations that could better address any ongoing issues.
In the coming weeks, Center Director Barry Denk and I will be hosting Pennsylvania Department of Environmental Protection Secretary Michael Krancer and Department of Agriculture Secretary George Greig on a tour of portions of the northeast region to see firsthand some of the impacts highlighted by local residents at the January listening session.
From there, we'll work with the secretaries and their departments to address the concerns that residents have, and we'll be sure to keep you up-to-date on the results of that tour and any subsequent actions taken to sort out the issues.
Senator Gene Yaw
Center Board Welcomes New House Members
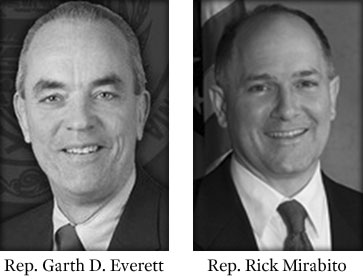
The Center for Rural Pennsylvania's Board of Directors welcomed Representative Garth D. Everett and Representative Rick Mirabito to the board in January.
Rep. Everett serves the 84th Legislative District, which includes parts of Lycoming County. He was first elected to the state House of Representatives in 2006 and serves on the Agriculture and Rural Affairs, Environmental Resources and Energy, Game and Fisheries, and Veterans Affairs and Emergency Preparedness committees.
Prior to serving in the House, he served on active duty in the U.S. Air Force for more than 20 years. After retiring from the Air Force, he attended and graduated from Penn State's Dickinson School of Law.
He is a board member of the River Valley Regional YMCA and a member of the National Rifle Association, VFW, American Legion, and Highland Lake 40 & 8.
Rep. Mirabito serves the 83rd Legislative District, which includes parts of Lycoming County. He was first elected to the state House of Representatives in 2009. He serves on the Agriculture and Rural Affairs, Commerce, Finance, and Local Government committees.
Prior to serving in the House, he served as court counsel to the Supreme Court in the island nation of the Republic of Palau and as a law clerk to a U.S. District Judge in Williamsport. He graduated from Cornell University and Boston College Law School.
Rural Snapshot: Women
There were 1.74 million females and 1.72 million males in rural Pennsylvania in 2010, a difference of only 20,000, according to U.S. Census Bureau data. From 2000 to 2010, the number of rural females increased less than 1 percent while males increased 4 percent.
In urban Pennsylvania, females outnumbered males by some 300,000 (4.77 million and 4.47 million, respectively). From 2000 to 2010, the number of urban females increased 3 percent while males increased 5 percent.
Although the number of rural females and males is close, there are some demographic and socio-economic differences between the genders, according to data from the U.S. Census Bureau's 2010 American Community Survey Public Use Microdata Sample (ACS-PUMS). Following is a rundown of the 2010 data.
Age
The average rural female was 41.7 years old and the average rural male was 39.2 years old. Among rural residents under 65 years old, 51 percent were male and 49 percent were female. Among senior citizens (65 years and older), 57 percent were female and 43 percent were male.
Marital Status
Fifty-three percent of adult rural females (18 years old and older), were married and 55 percent of adult rural males were married. For both genders, 77 percent were married once, 19 percent were married twice, and 4 percent were married three or more times. On average, of those who were presently married, the wife was 26 years old and the husband was 29 years old when they got married. The typical rural married couple has been married 25 years. Approximately 9 percent of rural married couples have been married for 50 years or more.
Of rural adult females who were not married, 26 percent were widowed, 29 percent were divorced or separated, and 45 percent were never married. Among rural adult males who were not married, 8 percent were widowed, 27 percent were divorced or separated, and 65 percent were never married.
Educational Attainment
Nineteen percent of rural adult females had a bachelor's degree or higher compared to 18 percent of males. Although rural females and males had similar educational attainment levels, there was a significant gap between rural and urban females, as 28 percent of urban adult females had a bachelor's degree or higher.
Employment
Fifty-six percent of rural adult females were in the labor force; that is, they were either employed or unemployed but looking for work. Among rural adult males, 66 percent were in the labor force. Forty-four percent of rural adult females were not the labor force; however, their average age was 60. Of the rural females in the labor force, 7 percent were unemployed. The unemployment rate for rural males was 10 percent.
Among rural females who were employed, 53 percent worked full-time (35 or more hours a week) and year-round (50 weeks or more per year). Among employed rural males, 65 percent worked full-time, year-round. and among employed urban females, 56 percent worked full-time, year-round.
Sixty-five percent of employed rural females worked for a private, for-profit company; 13 percent worked for a non-profit organization; 15 percent worked for a local, state, or federal government agency; 6 percent were self-employed; and less than 1 percent worked without pay in a family business or farm.
Wages/Salaries
The median wage for rural females was $30,430, while the median for males was $42,320. That's a wage gap of $11,890. In addition, urban females earned a median of $38,290, $7,860 more than rural females.
Poverty
The poverty rate for rural females was 14 percent while the rate for males was 12 percent. The poverty rate for urban females was also 14 percent.
The poverty rate for rural females was highest among those under 18 years old at 19 percent, followed by those aged 18 to 64 years old at 14 percent and senior citizens at 9 percent.
Rural females who were divorced or separated had a higher poverty rate (26 percent) than to those who were married (5 percent).
Of the rural adult females who were in poverty, 62 percent were not in the labor force, 29 percent were employed and 9 percent were unemployed. Among rural adult males who were in poverty, 54 percent were not in the labor force, 30 percent were employed, and 16 percent were unemployed.Fast Fact: Unemployment\Employment Rates
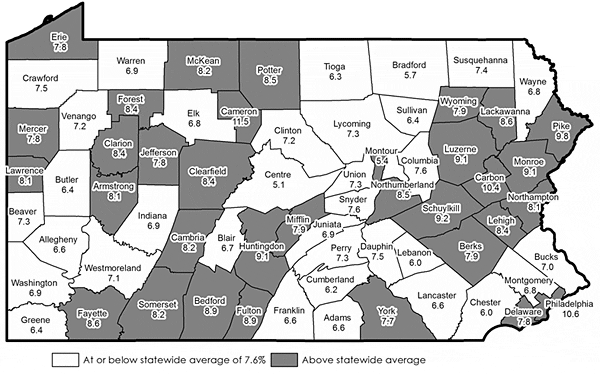
Pennsylvania County Unemployment Rates, December 2011

Counties with the Highest Rates: Cameron = 11.5%; Philadelphia = 10.6%; Carbon = 10.4%.
Counties with the Lowest Rates: Centre = 5.1%; Montour = 5.4%; Bradford = 5.7%.
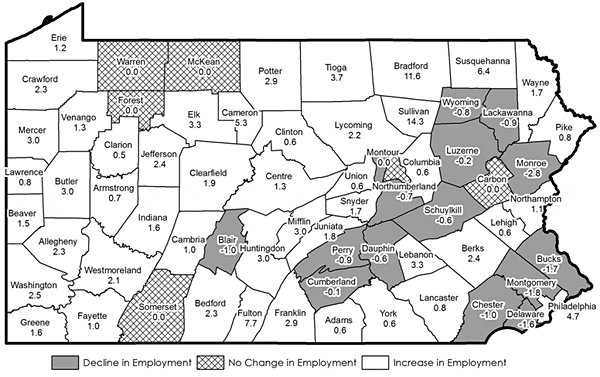
Change in Employment Rates, December 2010 to December 2011

Counties with the Largest Increases: Sullivan = 14.3%; Bradford = 11.6%; Fulton = 7.7%.
Counties with the Largest Decreases: Bucks = -1.7%; Montgomery = -1.8%; Monroe = -2.8%.
Data source: Pennsylvania Department of Labor and Industry. Data are seasonally adjusted.
Reported Incidents of Bullying in Pennsylvania Schools
Pennsylvania's 235 rural school districts reported 1,134 incidents of bullying during the 2009-10 school year. During the 2007-08 school year, rural schools reported 537 incidents.
The state's 265 urban districts reported 3,641 bullying incidents during the 2009-10 school year, and 917 incidents during the 2007-08 school year.
Bullying, according to the Pennsylvania Department of Education's Safe Schools Office, is an intentional electronic, written, or verbal act, or series of acts, that is severe, persistent or pervasive. It is directed at one or more students, substantially interferes with another student's education, creates a threatening environment, or disrupts the orderly operation of the school.
Between rural and urban Pennsylvania school districts, there was a slight, but not significant, difference in the number of reported bullying incidents per student in 2009-10: rural districts had 2.5 bullying incidents per 1,000 students and urban districts had 2.7 per 1,000 students.
To determine if there were any relationships between the number of reported bullying incidents in rural schools and certain social, economic and academic variables, the Center for Rural Pennsylvania analyzed data from the Pennsylvania Department of Education and the U.S. Census Bureau. For the analysis, the Center combined three years of bullying data (2007-08, 2008-09, and 2009-10) and compared them with school district socio-economic and academic data, including household income, types of households, poverty rates, educational attainment, school test scores, student-teacher ratios and school revenues/expenditures.
The results showed that 44 rural districts, or 19 percent of all rural districts, had no reported bullying incidents. In general, these districts did not exhibit any statistically significant differences from other rural districts, except that the 44 districts with no reported bullying incidents had fewer reported total school safety incidents, such as assault, robbery, or drug possession, per 1,000 students.
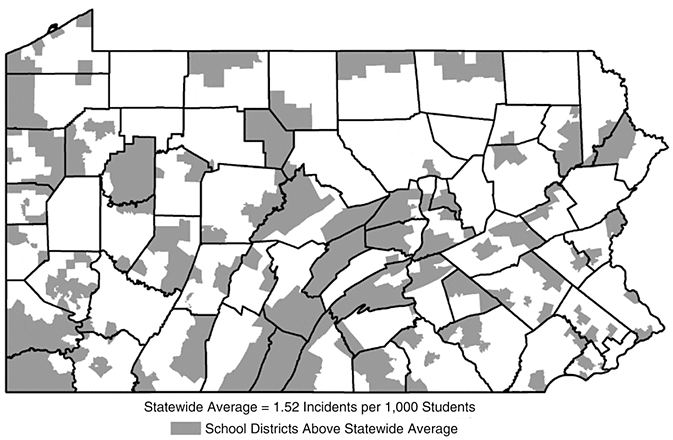
Among the 191 rural districts with reported bullying incidents, 54 percent had incidents at or below the statewide average of 1.5 reported incidents per 1,000 students. Forty-six percent had incidents above the statewide average.
There appeared to be few differences between rural districts with incidents of bullying above and below the statewide average. For example, both had similar total school expenditures per student, comparable percentages of students who were eligible for the free and reduced school lunch program and nearly comparable percentages of students scoring below-basic in the PSSA math and reading tests.
One area in which these two types of districts differed was fighting. Rural districts with higher reported incidents of bullying had more reported incidents of fighting than districts with lower reported incidents of bullying.
In summary, the number of reported incidents of bullying from 2007-08 to 2009-10 doubled. This increase could be the result of better reporting by school districts and an increased awareness of bullying.
Second, bullying incidents are not limited to districts with unique characteristics, such as low-test scores among students, or high poverty rates in the district. Instead, bullying appears to be a statewide issue, and not one that is pervasive in strictly rural or urban school districts.
School Districts with Bullying Rates Above Statewide Average, 2007-08 to 2009-10

Data source: Pennsylvania Department of Education, Safe and Drug-Free Schools.
Just the Facts: Homelessness
In late March 2010, Census Bureau enumerators went to emergency and transitional shelters to count the number of people who were homeless on that particular day. In Pennsylvania rural counties, the enumerators counted a total of 1,009 individuals. In the state's urban counties, they counted 7,278 persons.
While this count provides some indication of the number of people who are homeless, it most likely under-represents the number of people experiencing homelessness, especially those in rural areas.
According to the National Coalition for the Homeless, people experiencing homelessness in rural areas are less likely to live on the street or in a shelter and more likely to live in a car or camper, or with relatives in overcrowded or substandard housing.
Another way to measure the number of those who are homeless is to examine the number of people who receive assistance from the Pennsylvania Department of Public Welfare's Homeless Assistance Program (HAP). This program provides services to people to help prevent homelessness, to provide refuge and care to those who are homeless, and to provide assistance to those who are homeless or near homeless in moving toward self-sufficiency.
In 2009-2010, more than 28,300 people, or about 8 people out of every 1,000 residents, in rural Pennsylvania received HAP assistance. In urban Pennsylvania, approximately 62,400 persons, or 7 people out of every 1,000 residents, received HAP assistance.
According to HAP's client report, in rural counties, 60 percent of those who benefited from assistance were adults and 40 percent were children. Approximately 2 percent of the rural adult clients were veterans. These percentages are very similar to those in urban counties.
Adult clients are sometimes referred to HAP county offices through various human service agencies. According to the HAP report, in rural counties, 11 percent of clients were referred from mental health service providers; 6 percent were referred from providers of drug and alcohol services; and 5 percent were referred from providers of domestic violence services. In urban counties, the percentages were nearly identical to those in rural counties, except for those referred from mental health service providers (8 percent).

