Newsletters
- Home
- Publications
- Newsletter Archive
- Newsletter
March/April 2011
Inside This Issue:
- Electricity Restructuring Impacts in Rural Pennsylvania
- Director's Message
- Coming to America: A Closer Look at Foreign-Born Residents in Pennsylvania and the U.S.
- LIHEAP Participation Among Pennsylvania Householders
- Just the Facts: The Highway Less Traveled
Electricity Restructuring Impacts in Rural Pennsylvania
For many electricity consumers in Pennsylvania, January 1, 2011 marked a beginning and an ending. It was the start of a new year and the end of rate caps on the price of electricity.
Some 14 years earlier, electricity restructuring was mandated in Pennsylvania and introduced a number of significant changes in the commonwealth’s electricity industry. Wholesale markets for electric generation were almost completely deregulated, and utilities in Pennsylvania were encouraged to sell their generation assets and purchase power from the market.
The restructuring also capped retail electric rates for a “transition period.” The final transition period ended January 1, 2011, when all electricity consumers in Pennsylvania served by state-regulated utilities were to pay electricity prices determined by market forces.
During the transition period, however, market-based electricity prices were variable.
In 2005 in rural Pike County, for example, rates climbed 50 percent overnight when a utility’s rate caps expired.
And in 2008, the Pennsylvania Public Utility Commission (PUC) projected that retail electricity rates would increase dramatically if price caps had been lifted at that time. By July of that year, however, electricity prices had fallen by more than one-third, largely because of natural gas price decreases.
Utilities had also started to prepare for the post-cap era by participating in a number of power procurement auctions. By holding a series of staggered competitive auctions, utilities could reduce the risk that electric rates would be determined entirely by market conditions at a specific point in time.
Estimating impacts on rural consumers
In 2009 and 2010, Pennsylvania State University researchers Dr. Andrew Kleit, Dr. Seth Blumsack, Dr. Zhen Lei, Lora Hutelmyer, Mostafa Sahraei-Ardakani and Stephon Smith conducted research to examine the likely impacts of electricity restructuring on rural Pennsylvania ratepayers. The Center for Rural Pennsylvania sponsored the research.
To uncover how the rate cap expiration might affect rural Pennsylvanians, the researchers examined events in the PPL Electric territory, located primarily in eastern Pennsylvania, where caps expired on January 1, 2010.
According to the research, the PPL experience showed that competition for retail business would be robust. A large number of providers in that territory were offering products with a variety of different characteristics.
In the first three months following PPL’s rate cap expiration, close to 30 percent of PPL retail customers moved to alternative suppliers.
The research also examined several issues dealing with electricity prices in a restructured Pennsylvania market.
It found a regional, east-west divide in electricity prices. One significant factor contributing to the price differences was the primary types of resources used to generate electricity in these regions. The eastern region was dominated by electricity generation from petroleum, natural gas, and nuclear power, while the western region was dominated by electricity generation from coal.
The results also indicated that Pennsylvania electricity prices, especially in the eastern part of the state, were prone to variations in the price of natural gas and oil. These fuel prices were likely to remain volatile into the future, even if development of the Marcellus Shale continues at a robust pace.
The research also examined the results of more recent procurement auctions in the state and found that utilities in western Pennsylvania were able to obtain lower prices than utilities in eastern Pennsylvania.
The difference in prices between eastern and western Pennsylvania appeared persistent, pointing towards fundamental differences in the generation mix and cost structures for eastern utilities.
The price differences also suggested that one cannot think of Pennsylvania as having a unified electricity market as transmission constraints have separated the state into a generation-rich “west” versus a high-priced “east.”
Report available
For a copy of the report, Impacts of Electricity Restructuring in Rural Pennsylvania, contact the Center for Rural Pennsylvania at (717) 787-9555, email info@rural.palegislature.us or visit www.rural.palegislature.us/reports.
Western and Eastern Regions of Pennsylvania by Rural and Urban County
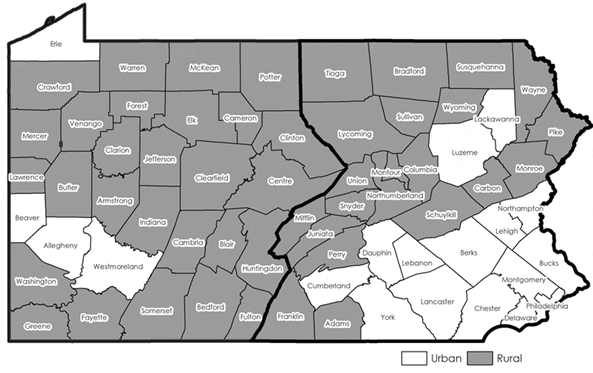
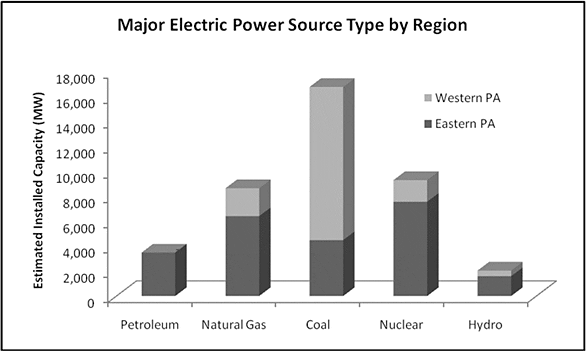
(Source: U.S. Energy Information Administration's State Energy Profile)
Director's Message
For our regular readers, you will recall that this column space is reserved for the Chairman. Well, I’m pinch hitting for this issue as our new board appointments are being finalized. I extend a very sincere thank you to our outgoing board chairman, Senator John Gordner, for his guidance and leadership.
One of the great benefits of my job is the opportunity to speak at conferences and meetings about the work of the Center and what’s happening in rural Pennsylvania. There is always a story to tell, a success to share or, at times, an alarm to ring. The audiences are as diverse as they come. They’ve included high school students in Elk County, business and civic leaders in Gettysburg, and borough officials from Cambria County. Regardless of the audience, or topic, my presentations always include this message: Rural Matters!
For many of the people listening to me, they readily get that message. They understand how the success and viability of Pennsylvania’s 3.4 million rural residents, their towns and communities, are so connected to the success of our entire commonwealth. Rural Pennsylvania’s people, land and natural resources have generated food, fiber, energy and wealth that have benefitted the entire state for generations and continue doing so today. Our rural landscape and people serve as hosts to visitors and vacationers from all over the country and world who want to experience, firsthand, Pennsylvania’s history, heritage, and quality of life. They know that rural Pennsylvania matters.
That message came out loud and clear at a national conference in Washington, DC in March. The Local Initiatives Support Corporation (LISC) commemorated its 30th anniversary of investing in the building of sustainable communities across urban and rural America. It brought together hundreds of corporate and philanthropic leaders, government officials, and community practitioners.
I was honored to be part of the program that presented a perspective on rural America - Pennsylvania style. Our panel presented the success stories of Tamaqua, Schuylkill County and Uniontown, Fayette County - two rural investment initiatives of LISC. Both communities, while still dealing with multiple challenges, have achieved much success. Before a very influential and mostly urban-oriented audience, our presentations collectively reinforced why rural matters. It is a message I was most comfortable delivering.
While I often get to tell Pennsylvania’s story and why rural matters, it is not mine to tell alone. I submit that that opportunity, that responsibility, exists for many more. From the township supervisor to the newspaper editor, student council president, Main Street entrepreneur and all who live, work and play in rural Pennsylvania, we have a story to tell. Rural does matter. It is not second class, it is not the runner-up. It is part of our nation’s and our state’s past, present and future.
Barry L. Denk
Coming to America: A Closer Look at Foreign-Born Residents in Pennsylvania and the U.S.
According to five-year estimates from the U.S. Census Bureau’s American Community Survey, there were 74,378 foreign-born residents living in rural Pennsylvania counties and 582,700 foreign-born residents living in urban Pennsylvania counties in 2005-2009. That’s 2 percent of the total rural population and 6 percent of the total urban population in Pennsylvania.
Since 1980, the number of foreign-born residents living in rural Pennsylvania increased 36 percent. In urban counties, there was a 68 percent increase.
Among foreign-born residents in rural Pennsylvania in 2005-2009, 54 percent were naturalized, which means they became U.S. citizens after meeting various legal requirements, and 46 percent were not. In urban counties, 49 percent of foreign-born residents were naturalized and 51 percent were not.
The counties with the largest percentages of foreign-born residents were Philadelphia, Monroe, Montgomery and Lehigh. In each of these counties, more than 8 percent of the population was foreign-born. The counties with the smallest percentages of foreign-born residents were the rural counties of Bedford, Blair, Cameron, Clarion, Clearfield, Fayette, Fulton, Jefferson, McKean, Mifflin, Perry, Somerset and Venango. In each, less than 1 percent of residents was foreign-born.
The top three countries from which rural foreign-born residents came were Mexico, Germany and India. Individuals from these three countries made up 21 percent of rural Pennsylvania’s foreign-born population. In urban areas, the top three countries were India, Mexico, and China.
About 32 percent of rural foreign-born residents entered the U.S. before 1980, 43 percent entered between 1980 and 1999, and 25 percent entered in 2000 or later.
Among rural foreign-born residents (5 years and older), 69 percent said they speak English only or speak English very well, 18 percent said they speak English well, and 13 percent said they do not speak English well or at all.
Nationwide, there were 37.3 million foreign-born persons, or 12 percent of the entire population. According to U.S. Census data, 50 percent of the foreign-born population lives in just 31 counties out of more than 3,100 counties or their equivalent nationwide.
From 1980 to 2005-2009, the number of foreign-born residents increased 165 percent nationwide. California, Florida, New York, and Texas had the highest number and percent of foreign-born residents. Each had more than 3 million foreign-born residents, accounting for 15 percent or more of their populations. Pennsylvania had the nation’s 13th highest number of foreign-born residents with 657,078.
Nationwide, rural counties with 5 percent or more of foreign-born residents performed better economically than those with lower percentages of foreign-born residents.
For example, from 2000 to 2009, rural counties with a higher percentage of foreign-born residents had higher job growth than rural counties with fewer foreign-born residents (5 percent and -3 percent, respectively). From 2000 to 2008, rural counties with a higher percentage of foreign-born residents had a larger increase in new businesses (11 percent) and higher annual wages ($39,818) than counties with a lower percentage of foreign-born residents (3 percent and $34,472, respectively).
One exception was the unemployment rate: in 2009, rural counties with a higher percentage of foreign-born residents had higher unemployment rates (10.2 percent vs. 9.7 percent, respectively).
Rural Pennsylvania Foreign-Born Residents
44 Average age of foreign-born residents in rural Pennsylvania. That’s 4 years older than the average native-born resident (40 years old).
67 Percent of rural foreign-born adults (18 years old and older) who are married. 59 percent of native-born adults are married.
38 Percent of rural foreign-born households that have children (under 18) living in the home. 30 percent of native-born households have children living in the home.
2.7 Average number of people in rural foreign-born households. Average native-born households have 2.4 people.
37 Percent of rural foreign-born adults with a bachelor’s degree or higher. 18 percent of native-born adults have a bachelor’s degree or higher.
64 Percent of rural foreign-born householders who own their home. 75 percent of native-born householders own their home.
45 Percent of foreign-born householders who have been living in the same home for 5 or more years. 67 percent of native-born householders have been living in the same home for 5 or more years.
$50,919 Median income of rural foreign-born householders. For native-born householders, the median was $44,346.
29 Percent of rural households with foreign-born residents only. 71 percent of households with foreign-born residents have a mixture of foreign-born and native-born residents.
Data source: U.S. Census Bureau’s 2006-2008 Public Use Microdata Sample (PUMS). These data are based on a sample of the 2006-2008 American Community Survey. The data used here exclude persons living in group quarters, such as school dormitories, prisons, and nursing homes.
Percent of Foreign-Born Residents in Pennsylvania, 2005-2009
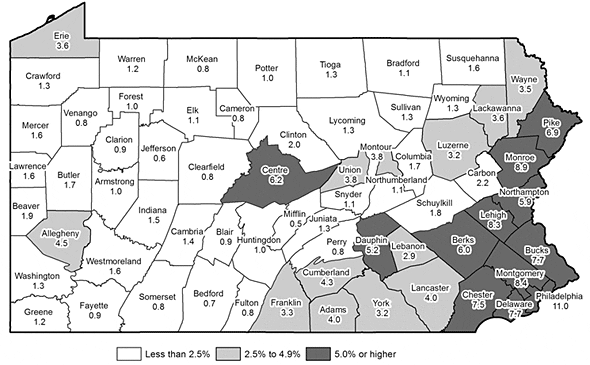
Data source: U.S. Census Bureau, American Community Survey, 2005-2009
Percent of Foreign-Born Residents in the United States, 2005-2009
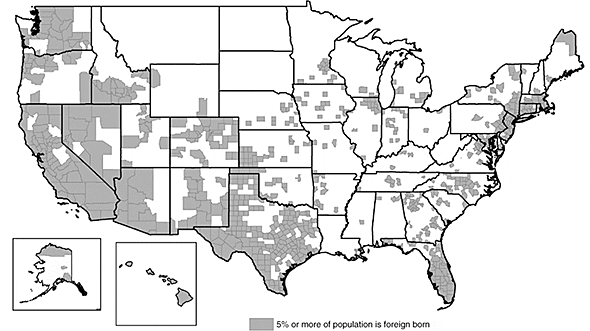
Data source: U.S. Census Bureau, American Community Survey, 2005-2009
LIHEAP Participation Among Pennsylvania Householders
Home heating systems typically gets a good workout during Pennsylvania winters. According to the National Oceanic and Atmospheric Administration’s National Climate Data Center, temperatures in Pennsylvania from October to December 2010 were below normal, so Pennsylvania householders probably turned up the dial on their thermostats more than once this past winter.
Recognizing that home heating costs can be a challenge for low-income residents, Congress established the Low Income Energy Assistance Program (LIHEAP) in 1981. In Pennsylvania, the program is administered by the Departments of Public Welfare and Community and Economic Development.
The program has three components: cash, crisis and weatherization. The cash component provides cash payments to help low-income households pay home heating fuel costs. The crisis component provides funding to help low-income households that are without heat or are in imminent danger of being without heat. And the weatherization component assists low-income homeowners with making their homes more energy efficient. This could include installing insulation, and repairing or replacing heating systems.
To better understand the use of LIHEAP in rural Pennsylvania, the Center for Rural Pennsylvania analyzed the cash and crisis components of the program. These two components are administered by the Department of Public Welfare.
During the 2009-2010 program year, 11 percent of all rural households, or 149,573, received cash assistance. These households received a total of $70.7 million, or an average of $473 per household. Among all urban households, 8 percent, or 284,554, received assistance. The total amount received by these households was $135.7 million, or an average of $477 per household.
From 2006-2007 to 2009-2010, the number of rural households receiving LIHEAP cash assistance increased 13 percent. Among urban households, there was a 20 percent increase.
A smaller number of rural and urban households received crisis assistance from LIHEAP in 2009-2010. In rural counties, there were 60,695 recipients, accounting for 4 percent of all rural households. These households received a total of $22.4 million, or an average of $369 per household.
In urban counties, 71,473 households, or 2 percent of all urban households, received crisis assistance. These households received a total of $24.7 million, or an average of $346 per household.
From 2006-2007 to 2009-2010, the number of rural households receiving LIHEAP crisis assistance decreased approximately 1 percent. Among urban households, the number receiving LIHEAP crisis assistance declined 7 percent.
In rural counties, there was a significant correlation between the percent of households receiving LIHEAP cash assistance and median housing values; the higher the percentage of households receiving cash assistance, the lower the housing values in the county. The same was true for household income and householder educational attainment levels.
There was a similar pattern among rural households receiving LIHEAP crisis assistance; the higher the percentage of households receiving crisis assistance in rural counties, the lower the housing values, household income, and householder educational attainment levels in the counties.
In 2005-2006, among all 50 states, Pennsylvania was among the top five in the number of households receiving heating cash assistance (385,000) and the percent of households receiving heating cash assistance (8 percent). New York had the highest number of households receiving assistance (847,400) and the highest percent of households receiving assistance (12 percent).
During that same time period, Pennsylvania was also among the top five states in the number of households receiving crisis assistance (153,481) and the percent of households receiving crisis assistance (3 percent).
At the county level in Pennsylvania, Fayette, Cameron, and Philadelphia had the highest percentage of households receiving LIHEAP cash assistance; in each of these counties, more than 17 percent of households received assistance. Bucks, Chester and Montgomery counties had the lowest percentage of households receiving cash assistance; in each, less than 3 percent of households received assistance.
The counties with the highest percentage of households receiving LIHEAP crisis assistance were Bedford, Clearfield, Fayette, and Huntingdon. In each of these counties, more than 9 percent of households received crisis assistance. In Adams, Bucks, Chester, and Montgomery counties, less than 1 percent of households in each county received crisis assistance.
Just the Facts: The Highway Less Traveled
In 2009, rural Pennsylvanians weren’t heading down the highway as much as they were in 2005.
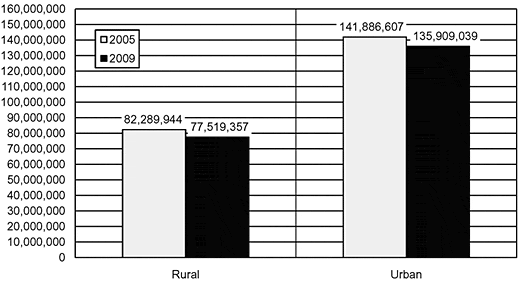
According to data from the Pennsylvania Department of Transportation, from 2005 to 2009, rural Pennsylvania counties experienced a 6 percent decline, on average, in Daily Vehicle Miles Traveled (DVMT). DVMT is a measure of total miles travelled by all vehicles in a given location over a specific period of time.
From 2005 to 2009, urban counties experienced a 4 percent decline in DVMT.
In 2009, registered vehicles in rural counties averaged four more miles traveled daily than vehicles in urban counties.
According to data from the Federal Highway Administration’s Highway Performance Monitoring System, Pennsylvania as a whole experienced a 2 percent decline, on average, in annual miles traveled from 2005 to 2008.
Like Pennsylvania, the nation experienced a general decline in DVMT from 2005 to 2008.
While DVMT decreased in Pennsylvania, the number of licensed drivers grew by an average of 2 percent in rural counties and 4 percent in urban counties, from 2005 to 2009. The number of registered vehicles also grew by 4 percent in rural counties and 2 percent in urban counties, resulting in a statewide car-to-driver ratio of 1.3 vehicles per licensed driver in 2009.
The increase in registered vehicles and decrease in DVMT has contributed to a statewide decrease of about 7 percent, on average, in DVMT per registered vehicle from 2005 to 2009.
Total DVMT in Rural and Urban Pennsylvania Counties, 2005 and 2009
Data source: Pennsylvania Department of Transportation, 2005 and 2009
