Newsletters
- Home
- Publications
- Newsletter Archive
- Newsletter
March/April 2010
Inside This Issue:
- Rural Pennsylvania Hospitals: Identifying the Warning Signs of Financial Distress
- Center Issues 2011 Request for Proposals
- Chairman’s Message
- Department of Defense Spending on Procurements
- Fast Facts: Unemployment Rates in Pennsylvania and Across the Nation
- A Snapshot of Organic Farming in Pennsylvania
- Just the Facts: Diabetes and Obesity
Rural Pennsylvania Hospitals: Identifying the Warning Signs of Financial Distress
Rural hospitals are the healthcare backbone for many rural Pennsylvania communities. Almost 4 million residents in Pennsylvania rely on rural hospitals for a variety of healthcare services.
Over the past few decades, however, many rural hospitals have been facing challenging financial times. Some have been forced to close, while others have merged with other hospitals, eliminated or reduced services, or taken other actions to remain viable.
To take a more in-depth look at the financial health of rural hospitals in Pennsylvania, the Center for Rural Pennsylvania sponsored two research projects related to rural hospital finances in 2008.
While each project took a different approach to assess the financial viability of rural hospitals, both provide results that may help rural hospital administrators and policymakers to better understand the factors that threaten the financial viability of rural hospitals and the options that are available that may reduce the likelihood of financial distress.
A model to evaluate financial distress
Dr. John Trussel of Pennsylvania State University-Harrisburg and Dr. Patricia Patrick of Shippensburg University of Pennsylvania conducted their research to develop a comprehensive model for evaluating financial distress in general acute care hospitals in rural Pennsylvania. The researchers developed the model primarily to predict financial distress and to provide early warning signals of distress to decision-makers.
The risk factors
As a first step, the researchers determined the risk factors that are associated with financial distress in hospitals and analyzed them in five categories: structural, financial, patient mix, utilization, and market forces. Structural factors included a hospital’s rural or urban status, size, teaching status, critical access status, profit status, and system status. Financial factors included liquidity, solvency, charity care, and patient cost per day. Patient mix included Medicare, Medical Assistance and managed care, and reflects the type of reimbursement received for patient services. Utilization, a measure of how efficiently the hospital’s assets are employed, included length of stay, occupancy rate, and inpatient share of net patient revenue. Market forces included the regional poverty rate, percentage of elderly persons served, and hospital concentration or competition.
The researchers collected data to compute the risk factors for all urban and rural for-profit and nonprofit general acute care hospitals in Pennsylvania from 1997 to 2006. The data were used to predict whether or not a hospital was financially distressed.
Factors related to distress
The research results indicated that several risk factors were significantly related to financial distress. For example, compared with other hospitals and controlling for all of the other risk factors, an increased risk of financial distress was found in hospitals with lower ratios of current assets to current liabilities, lower ratios of cash flows to debt, lower costs per day, higher charity care, lower Medicare, Medicaid and managed care reimbursements, higher inpatient services (as opposed to outpatient services), shorter lengths of stay, and lower occupancy rates. An increased risk of financial distress was also found in hospitals that operated in counties with higher poverty rates, lower proportions of elderly patients, and higher competition among hospitals.
These results may allow decision makers to not only predict financial distress, but also evaluate the impact of a change in a risk factor on the likelihood of financial distress. For example, even a relatively small decrease in the amount of charity care provided by a hospital led to a significant decrease in the likelihood of financial distress.
Interestingly, when the researchers controlled for all risk factors, the rural status of a hospital significantly reduced the likelihood of financial distress. The researchers directly compared the risk factors of rural hospitals to urban hospitals. Rural hospitals operated with higher cash flows to long-term debt and lower costs per day, and operated in counties with less competition and with larger proportions of the elderly. Rural hospitals also provided less charity and inpatient care. All of these factors were associated with lower financial distress.
However, rural hospitals also tended to have fewer beds, less net patient revenues, lower ratios of current assets to current liabilities, and lower occupancy rates. These factors were associated with higher financial distress.
The research also found that critical access hospital status alone was not a predictor of distress, yet many of Pennsylvania’s critical access hospitals operated with significant risk of financial distress. Specifically, 59 percent were financially distressed during the study period. Critical access hospitals operated with fewer beds, had lower current ratios, had lower cash flows to long-term debt, and provided more charity care, all factors associated with higher financial distress.
Policy considerations
The researchers suggest that policy makers use the factors identified in this study as early warning signals of financial distress and implement the recommendations offered to reduce the likelihood of financial distress.
One consideration was for policy makers to designate a commonwealth agency to use the results of this study to monitor the financial health of Pennsylvania’s rural hospitals. This agency could provide support and assistance to rural hospitals in a manner not unlike a small business development center.
Determination of financial health
Dr. Jami DelliFraine, Lisa Davis, Harry Holtand Larry Baronner of Pennsylvania State University conducted research to examine the financial performance of rural hospitals from a number of perspectives, including profitability, liquidity, efficiency and capital structure.
The researchers conducted key informant interviews with rural hospital executives to determine what indicators the executives used to assess financial health at their hospitals. The key informant interviews also were conducted to examine the impact of organization structure, local market influences, state and federal policies, and strategic alliances on the financial performance of rural hospitals.
The researchers used this information, along with data from the American Hospital Association and the Pennsylvania Health Care Cost Containment Council from 1997 to 2006, to conduct analyses to determine differences in the financial performance of rural hospitals, critical access hospitals and all Pennsylvania hospitals.
According to the results, over the study period of 1997 to 2006, the financial health of rural hospitals was tenuous; and critical access hospitals were among the worst performing.
Trends also indicated that increased competition, physician recruitment and retention, and providing care for patients who are elderly, underinsured or uninsured are negatively impacting rural hospital finances.
Research results available
The results of both research projects are available in the report, Rural Hospital Financial Conditions.
Center Issues 2011 Request for Proposals
The Center for Rural Pennsylvania has released its 2011 Requests for Proposals for the 2011 Research Grant Program.
Eligible applicants for the grant program include faculty members from Pennsylvania State University, Pennsylvania State System of Higher Education universities, and the regional campuses of the University of Pittsburgh.
For a copy of the 2011 Request for Proposals or more information, visit the Center’s website at www.rural.palegislature.us or call or email (717) 787-9555 or gelensermk@rural.palegislature.us.
Chairman’s Message
The health care reform debate has been taking center stage at the national level for many months. It’s a rousing and important issue that deserves much consideration and discussion as its resolution will impact the entire country.
Closer to home is a health-care-related issue that impacts almost 4 million Pennsylvanians who count on rural hospitals for a variety of health care services.
As our feature story in this issue of Rural Perspectives states, some of the state’s rural hospitals have been realizing difficult financial times. According to data from the Pennsylvania Health Care Cost Containment Council, in 2006, 32 percent of hospitals in Pennsylvania reported financial losses and a disproportionate share of these hospitals were small community hospitals in rural areas.
The report, Rural Hospital Financial Conditions, summarizes the work of two research teams whose efforts resulted in a comprehensive model for evaluating financial distress in Pennsylvania’s general acute care hospitals, and an examination of the financial performance of all rural hospitals.
At both the national and state levels, debates on issues should be informed by research, and the Center trusts that these research projects will serve that purpose.
The Center also expects that its 2010 research projects, which are now underway, will yield results that are informative and critical.
As announced on Page 1, the Center’s research cycle continues, as it has just released the 2011 Research Grant Program Request for Proposals. Starting with the 2011 grant round, faculty members at the regional campuses of the University of Pittsburgh are eligible to participate in the program, along with faculty from Pennsylvania State University and the State System of Higher Education universities.
The 2011 targeted topic requests focus on aspects of Marcellus Shale development, the types and costs of State Police coverage, the impact of government funding cutbacks on the nonprofit community, and the implementation and impact of Act 119, which governs the operations of Pennsylvania dog kennels, and other topics related to education, agriculture and the economy.
Check out the Center’s website at www.rural.palegislature.us/rfp.html for the complete list of research topics, or call the Center for a hard copy of the Request for Proposals.
Be sure to check out the Center’s in-house analysis of spending by the federal Department of Defense (DoD) on Page 4 and its summary of the first-ever federal survey of organic farms, which was conducted by the United States Department of Agriculture’s National Agricultural Statistical Service, on Page 6.
As intended, this bi-monthly newsletter brings you just a sample of the considerable and diverse research and data of the Center for Rural Pennsylvania.
The research results and data are available to anyone interested in gaining a better understanding of the dynamics of our very diverse, and very rural, commonwealth. For more information or for specific data requests, call the Center or visit the website listed at left.
Senator John GordnerDepartment of Defense Spending on Procurements
A strong national defense requires materials and supplies, which includes everything from boots to tanks. The United States Department of Defense (DoD) obtains these items from private companies throughout the nation and reports its spending to the U.S. Census Bureau.
To determine how much DoD spent in rural and urban counties nationwide and in Pennsylvania, the Center for Rural Pennsylvania analyzed data from the Consolidated Federal Funds Report from the U.S. Census Bureau for fiscal years 2000 to 2008. The Center also used population and business establishment data from the U.S. Bureau of Economic Analysis and the U.S. Census Bureau.
Pennsylvania comparisons
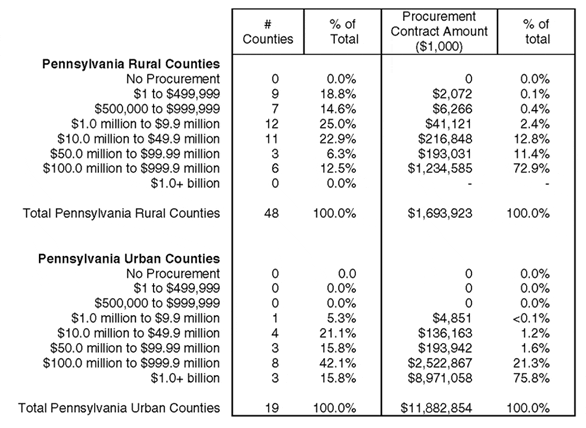
In 2008, DoD spent about $13.5 billion, or $1,086 per person, in procurement contracts in Pennsylvania. These contracts accounted for 12 percent of all federal spending in Pennsylvania.
The same year, DoD spent almost $2 billion, or $494 per person, in procurement contracts in Pennsylvania’s 48 rural counties. These contracts accounted for 6 percent of all federal expenditures in rural Pennsylvania.
Among Pennsylvania’s 19 urban counties, DoD spent almost $12 billion, or $1,311 per person, in procurement contracts, which accounted for 14 percent of all federal spending in urban Pennsylvania.
From 2000 to 2008, Pennsylvania saw a 174 percent increase in DoD procurement spending. Pennsylvania rural counties saw a 262 percent increase and urban counties saw a 165 percent increase.
At the county level, Allegheny, Delaware and York acquired the most in DoD contracts; each had more than $1 billion in contract procurements. Counties with the lowest amounts in contract procurements were Cameron and Sullivan, each with less than $50,000.
National comparisons
Across the U.S., in 2008, DoD authorized about $345 billion in procurement contracts, or $1,136 per person. Pennsylvania received the nation’s fourth highest procurement amount after Texas, Virginia and California. Each of these states received more than $37 billion in contracts. States with the least amounts in procurement contracts were Delaware, North Dakota, Wyoming and Idaho, each with less than $250 million.
Among the nation’s 2,349 rural counties, DoD procurement contracts totaled about $46 billion or $559 per person. Among the nation’s 790 urban counties, procurement contracts totaled almost $300 billion or $1,348 per person.
From 2000 to 2008, DoD procurement contracts nationwide increased 126 percent. Pennsylvania had the nation’s 14th largest increase (174 percent). Connecticut, Kentucky, Illinois and Oregon had the largest increases, each with more than 300 percent. Maine and Minnesota, on the other hand, had a decline in DoD procurement contracts.
When comparing Pennsylvania counties with counties across the U.S., the analysis showed no statistically significant difference in per capita DoD procurement spending in 2008. The same was true when comparing Pennsylvania’s rural and urban counties to their rural and urban counterparts nationwide.
Rural/urban comparisons
Nationwide, and in Pennsylvania, there was a significant difference in per capita DoD procurement contracts between rural and urban counties.
In Pennsylvania, there was an $817 per capita gap in contract spending between rural and urban counties. Nationwide there was a $789 rural-urban gap.
One similarity between rural and urban counties, both nationally and in Pennsylvania, was the rate of change in DoD procurement contracts. From 2000 to 2008, rural and urban counties saw a doubling of their procurement contract awards.
Fact sheet available
For the fact sheet, Department of Defense Spending in Rural and Urban Counties, visit the Center’s website at www.rural.palegislature.us, email info@rural.palegislature.us or call (717) 787-9555.
Distribution of Defense Procurement Contracts in Rural and Urban Counties in Pennsylvania, 2008

Source: Consolidated Federal Funds Report for Fiscal Year 2008, U.S. Census Bureau.
Fast Facts: Unemployment Rates in Pennsylvania and Across the Nation
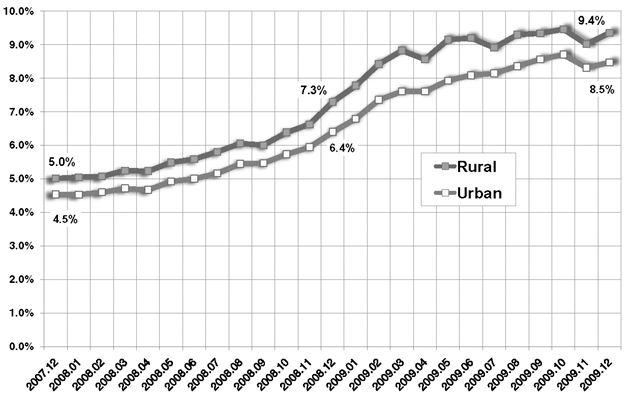
Unemployment Rate in Rural and Urban Pennsylvania, December 2007 to December 2009

Data source: Pennsylvania Department of Labor and Industry. Rates are seasonally adjusted.
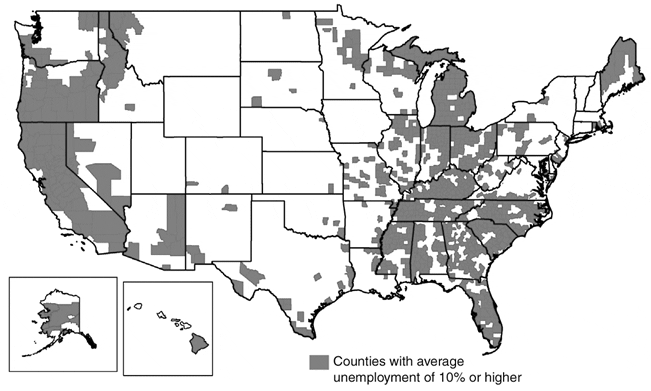
Counties with Average Unemployment Rate of 10 Percent or Higher, January to December 2009

Data source: U.S. Bureau of Labor Statistics. Rates are not seasonally adjusted.
A Snapshot of Organic Farming in Pennsylvania
Pennsylvania ranked third in the nation in organic product sales in 2008, according to recently released data from the United States Department of Agriculture’s (USDA) National Agricultural Statistical Service (NASS).
Pennsylvania’s 586 certified organic farms made roughly $213 million in sales in 2008.
The two states with higher sales of organic products were California, with about $1 billion in sales, and Washington, with about $282 million in sales.
The NASS data were collected as a follow-up survey to the 2007 Census of Agriculture. The follow-up survey was the nation’s first in-depth look at organic farming in the United States and was authorized as part of the 2008 Farm Bill.
Survey respondents included USDA-certified organic producers, producers exempt from USDA certification, and producers transitioning to organic.
Data highlights
Here are some data highlights from the survey:
• Nationwide, the total number of organic farms was 14,540 in 2008.
• On average, organic farms in Pennsylvania had sales in excess of $386,000. For all Pennsylvania farms, average sales were $91,900.
• Nationally, organic farms had average annual sales of nearly $217,700. For all farms nationwide, average annual sales were $134,800.
• Sixty-five percent of organic farms in Pennsylvania sold their products locally, which was defined as within 100 miles of the farm.
• Nationally, 57 percent of organic farms sold their products locally, or within 100 miles of the farm.
• Pennsylvania organic farms tend to be smaller than organic farms nationwide. In 2008, the average size of an organic farm in Pennsylvania was 96 acres, while the national average for organic farms was 285 acres.
• The amount of some of the organic products produced in Pennsylvania in 2008 was: squash (all varieties) at 1,153 tons, lettuce at 442 tons, apples at 427 tons, and potatoes at 245 tons.
• Pennsylvania is home to 11,000 organically raised milk cows and 600 organically raised beef cows.
• Pennsylvania had the most organically raised turkeys of any state at 34,900.
• When asked to identify their primary production challenges, Pennsylvania’s organic farmers identified the following as their top three problems: regulatory (42 percent), production (18 percent), and management issues (15 percent).
• When asked about their future plans, 31 percent of Pennsylvania’s organic farmers said they planned to increase organic production in the next five years, 44 percent said they planned to maintain their current level of organic production and 1 percent said they would decrease organic production over the next five years. Two percent of producers said they would discontinue organic production in the next five years and another 2 percent said they would discontinue all agriculture production. Twenty percent said they were unsure or did not know what their production plans were for the next five years.
Survey copies available
For more information about the survey or a copy of the 2008 Organic Production Survey, visit the USDA’s National Agricultural Statistical Service web site at www.agcensus.usda.gov/Publications/2007/Online_Highlights/Organics/index.asp.
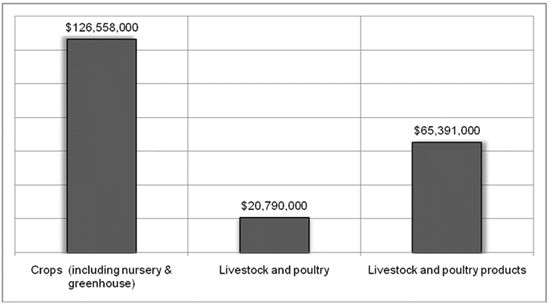
Value of Sales of Organically Produced Commodities in Pennsylvania, 2008

Data source: USDA National Agricultural Statistical Service.
Just the Facts: Diabetes and Obesity
According to data from the Centers for Disease Control and Prevention (CDC), the incidence of adult diabetes and obesity in Pennsylvania is increasing.
From 2004 to 2007 the number of rural adults 20 years old and older with diabetes increased 12 percent, and the number of rural adults with obesity increased 8 percent.
During the same period, the number of urban adults with diabetes increased 11 percent and the number of urban adults with obesity increased 11 percent.
Diabetes
In 2007, the CDC estimated that 9 percent of rural adults and 9 percent of urban adults had diabetes.
Throughout the state, higher levels of educational attainment were correlated with lower levels of diabetes.
In eastern Pennsylvania, for example, higher income levels were correlated to lower levels of diabetes, while higher levels of poverty and negative population change were correlated to higher levels of diabetes.
The counties with the highest percentages of diabetes were Fayette, Cambria and Armstrong.
The counties with the lowest percentages were Centre, Berks and Chester.
Nationwide, an estimated 10 percent of rural adults are diabetic, placing rural Pennsylvania below this average.
The states with the highest incidence of diabetes were Alabama, Mississippi and Georgia.
Colorado, Montana and Minnesota had the lowest incidence of diabetes.
Obesity
In 2007, the CDC estimated that 29 percent of rural adults and 27 percent of urban adults were classified as obese.
Throughout Pennsylvania, higher levels of educational attainment were related to lower obesity rates.
In eastern Pennsylvania, for example, higher levels of income were correlated with lower levels of obesity, while higher levels of poverty were correlated with higher levels of obesity.
The counties with the highest percentages of adults classified as obese were Fayette, Cambria and Washington. The counties with the lowest percentages were Chester, Bucks and Montgomery.
Nationwide, an estimated 28 percent of rural adults were classified as obese, placing rural Pennsylvania above this average. Alabama, Mississippi and West Virginia had the highest rates of obesity. Colorado, Massachusetts and Connecticut had the lowest.
